Fig. 1
Download original image
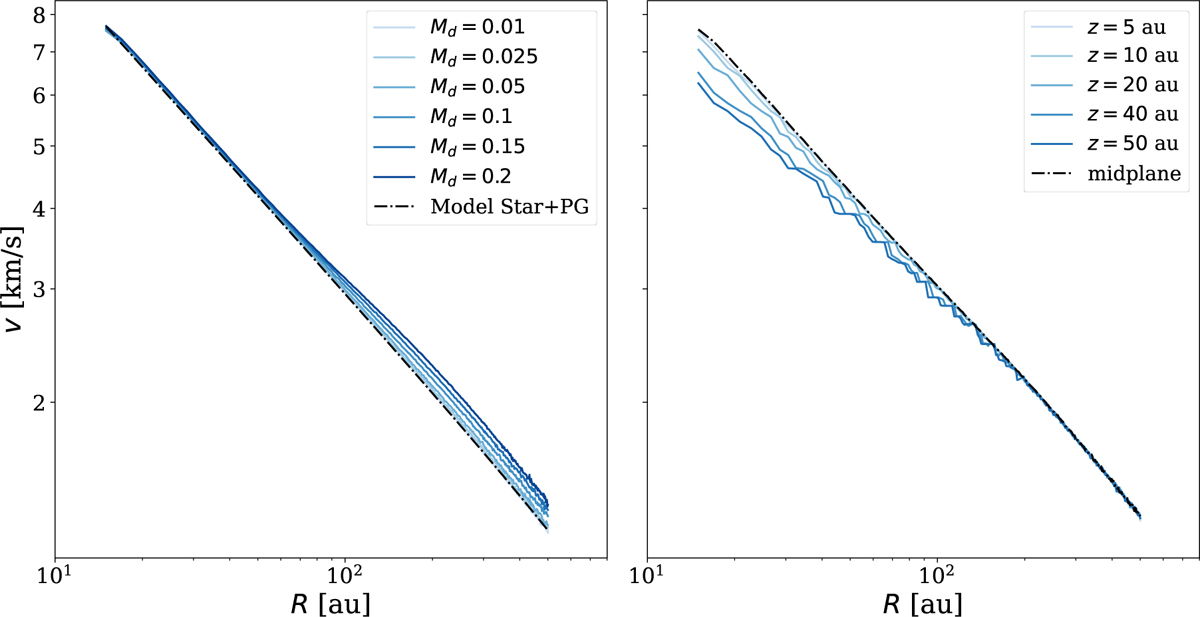
Rotation curves extracted from SPH simulations. Left: rotation curves in the midplane of the disc extracted from the SPH simulations with H/R100au = 0.075 after 20 orbits at the outer disc radius, for different disc-to-star mass ratios (solid lines). The black dash-dotted line shows the rotation curve of the model given by Eq. (5), including the pressure gradient term with zero disc mass. Except for profiles obtained with a disc-to-star mass ratio of 0.01, the rotation curves are distinct from a model without the disc self-gravity. Right: same as left panel but with Mdisc = 0.1 M⊙, with rotation curves extracted for different heights (blue solid lines), and compared to the one obtained in the midplane (z = 0, black dashed-dot line).
Current usage metrics show cumulative count of Article Views (full-text article views including HTML views, PDF and ePub downloads, according to the available data) and Abstracts Views on Vision4Press platform.
Data correspond to usage on the plateform after 2015. The current usage metrics is available 48-96 hours after online publication and is updated daily on week days.
Initial download of the metrics may take a while.