Fig. 3
Download original image
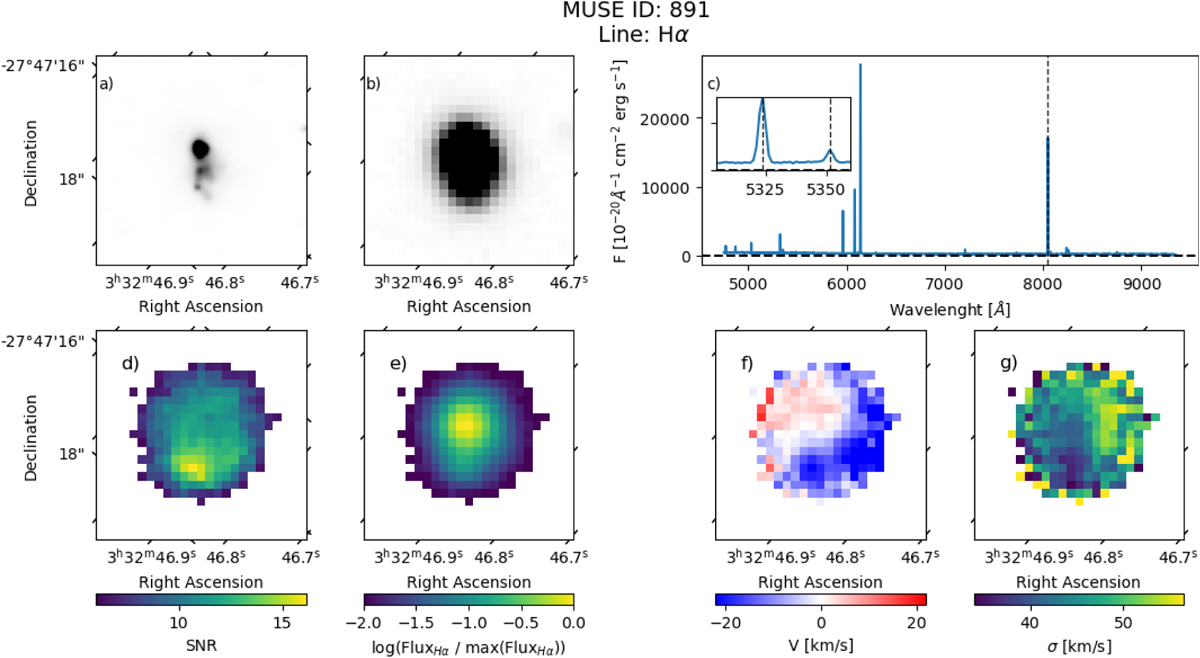
MUSE ID 891: (a) HST F775W image with the spatial coverage of the MUSE data cube; (b) MUSE white light image of the galaxy; (c) spectrum of the object with an inset window showing a zoomed-in view around the Hγ and [O III]λ4363 emission lines; and maps of (d) S/N, (e) normalized flux, (f) relative radial velocity, and (g) velocity dispersion (σ), for the emission line indicated in the figure header.
Current usage metrics show cumulative count of Article Views (full-text article views including HTML views, PDF and ePub downloads, according to the available data) and Abstracts Views on Vision4Press platform.
Data correspond to usage on the plateform after 2015. The current usage metrics is available 48-96 hours after online publication and is updated daily on week days.
Initial download of the metrics may take a while.