Fig. 8.
Download original image
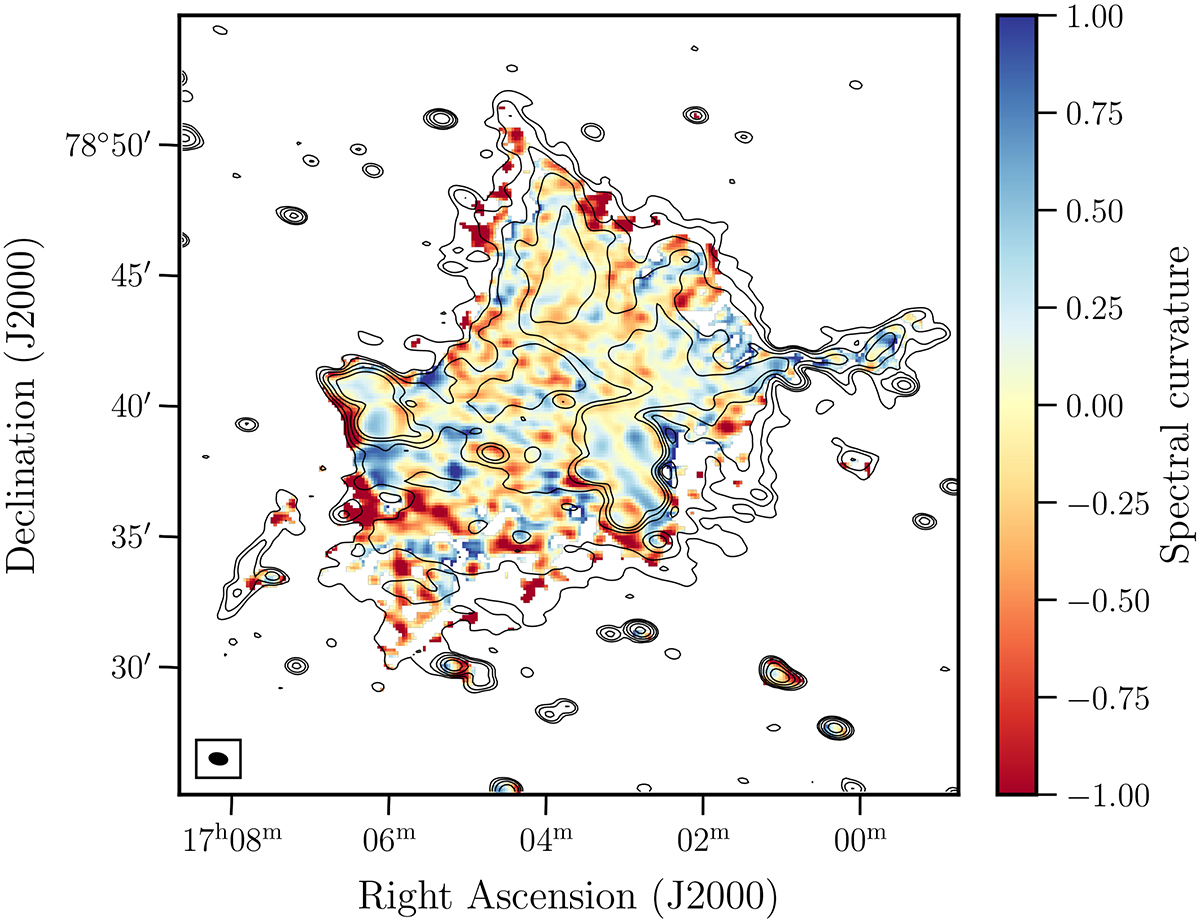
Spectral index curvature map of Abell 2256, calculated as ![]() , where both spectral index maps are made with a common resolution of 39″ × 24″. Blue regions indicate spectral steepening towards higher frequencies and red regions indicate flattening at higher frequencies. The background contours show the 144 MHz intensity smoothed to the same resolution.
, where both spectral index maps are made with a common resolution of 39″ × 24″. Blue regions indicate spectral steepening towards higher frequencies and red regions indicate flattening at higher frequencies. The background contours show the 144 MHz intensity smoothed to the same resolution.
Current usage metrics show cumulative count of Article Views (full-text article views including HTML views, PDF and ePub downloads, according to the available data) and Abstracts Views on Vision4Press platform.
Data correspond to usage on the plateform after 2015. The current usage metrics is available 48-96 hours after online publication and is updated daily on week days.
Initial download of the metrics may take a while.