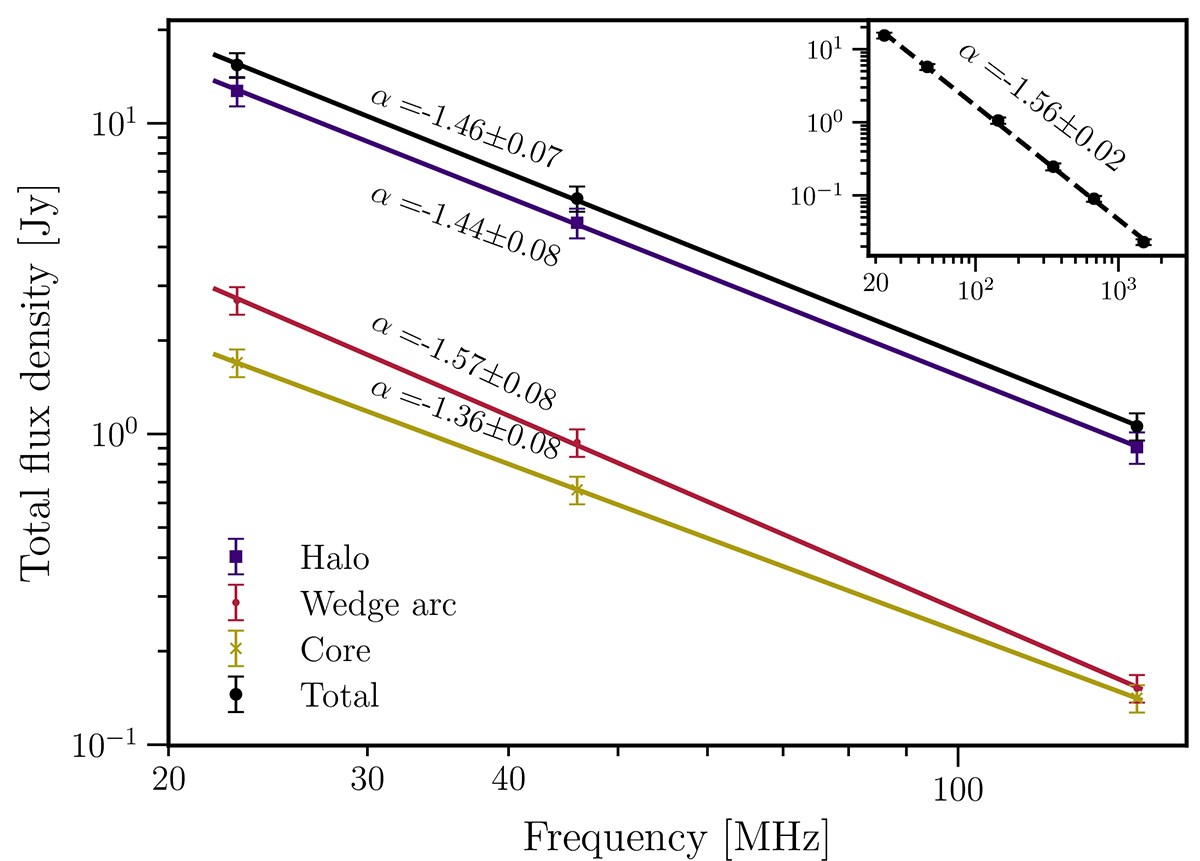
Fig. 5.
Download original image
Integrated spectrum of the radio halo between 23 and 144 MHz. The three regions used to compute the spectrum are shown in Fig. 1. The inset in the top-right corner shows the integrated spectrum with the addition of higher-frequency data from the recent study by Rajpurohit et al. (2023) and has the same axis labels as the main plot.
Current usage metrics show cumulative count of Article Views (full-text article views including HTML views, PDF and ePub downloads, according to the available data) and Abstracts Views on Vision4Press platform.
Data correspond to usage on the plateform after 2015. The current usage metrics is available 48-96 hours after online publication and is updated daily on week days.
Initial download of the metrics may take a while.