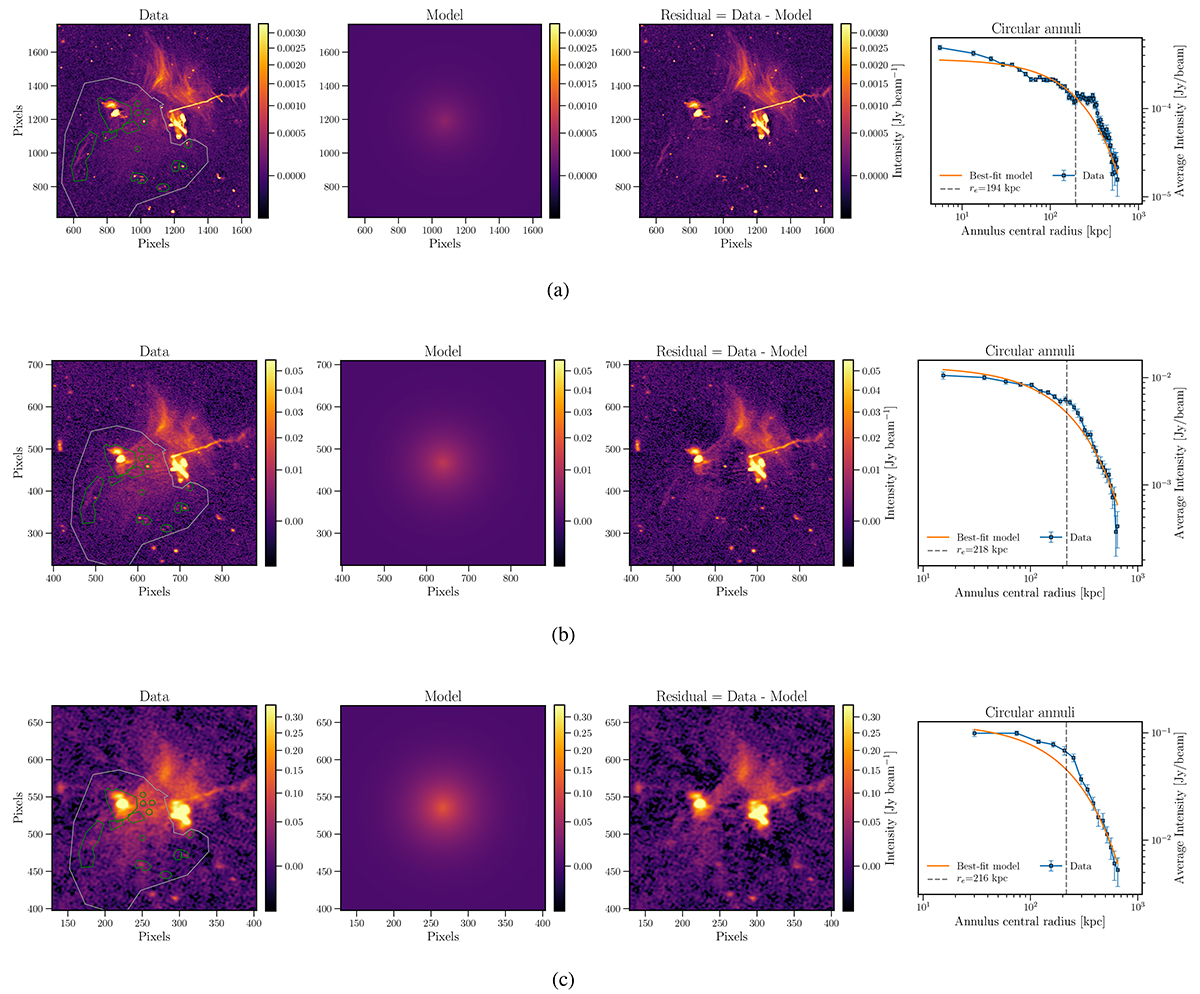
Fig. C.1.
Download original image
Halo fit results for various frequencies. The first panel shows the data, with masked sources indicated by the green regions and the fitting region indicated by the grey region. The second panel shows the best-fit halo model (Eq. C.1) and the third panel the residual image. The last panel shows the same fit visualised in one dimension calculated from concentric annuli. (a) 144 MHz. (b) 46 MHz. (c) 23 MHz
Current usage metrics show cumulative count of Article Views (full-text article views including HTML views, PDF and ePub downloads, according to the available data) and Abstracts Views on Vision4Press platform.
Data correspond to usage on the plateform after 2015. The current usage metrics is available 48-96 hours after online publication and is updated daily on week days.
Initial download of the metrics may take a while.