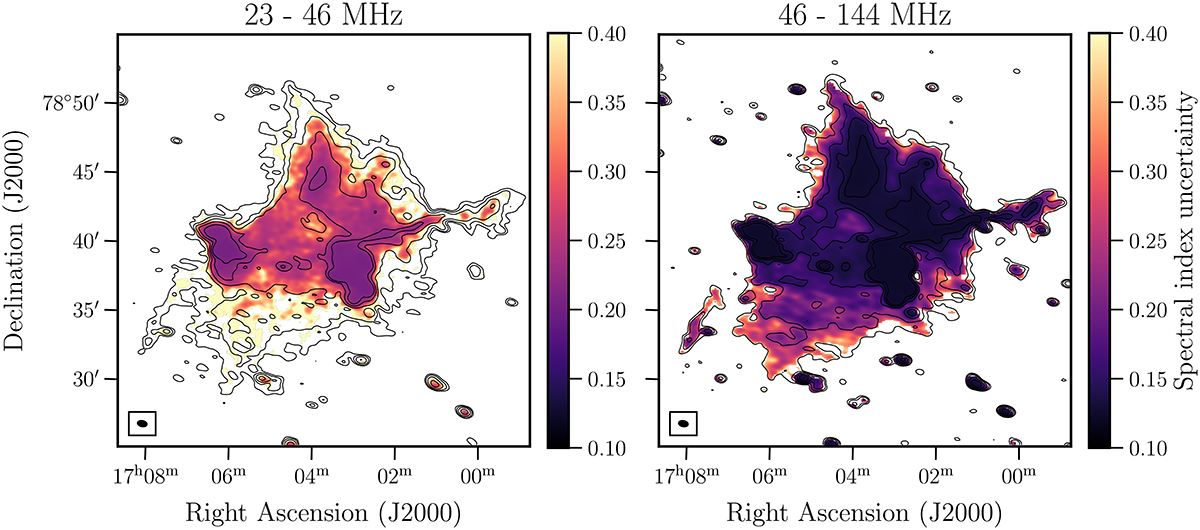
Fig. B.1.
Download original image
Spectral index uncertainty maps of Abell 2256, including a systematic 10% flux scale uncertainty and map noise, at different frequencies with the restoring beam shown in the bottom left inset. Both maps have been smoothed to a common resolution of 39″ × 24″. The median uncertainties are 0.31 and 0.19 in the left and right image, respectively. The contours show higher frequency [3, 6, 12, 24, 48]σ levels where σ denotes the background rms noise level.
Current usage metrics show cumulative count of Article Views (full-text article views including HTML views, PDF and ePub downloads, according to the available data) and Abstracts Views on Vision4Press platform.
Data correspond to usage on the plateform after 2015. The current usage metrics is available 48-96 hours after online publication and is updated daily on week days.
Initial download of the metrics may take a while.