Fig. 11.
Download original image
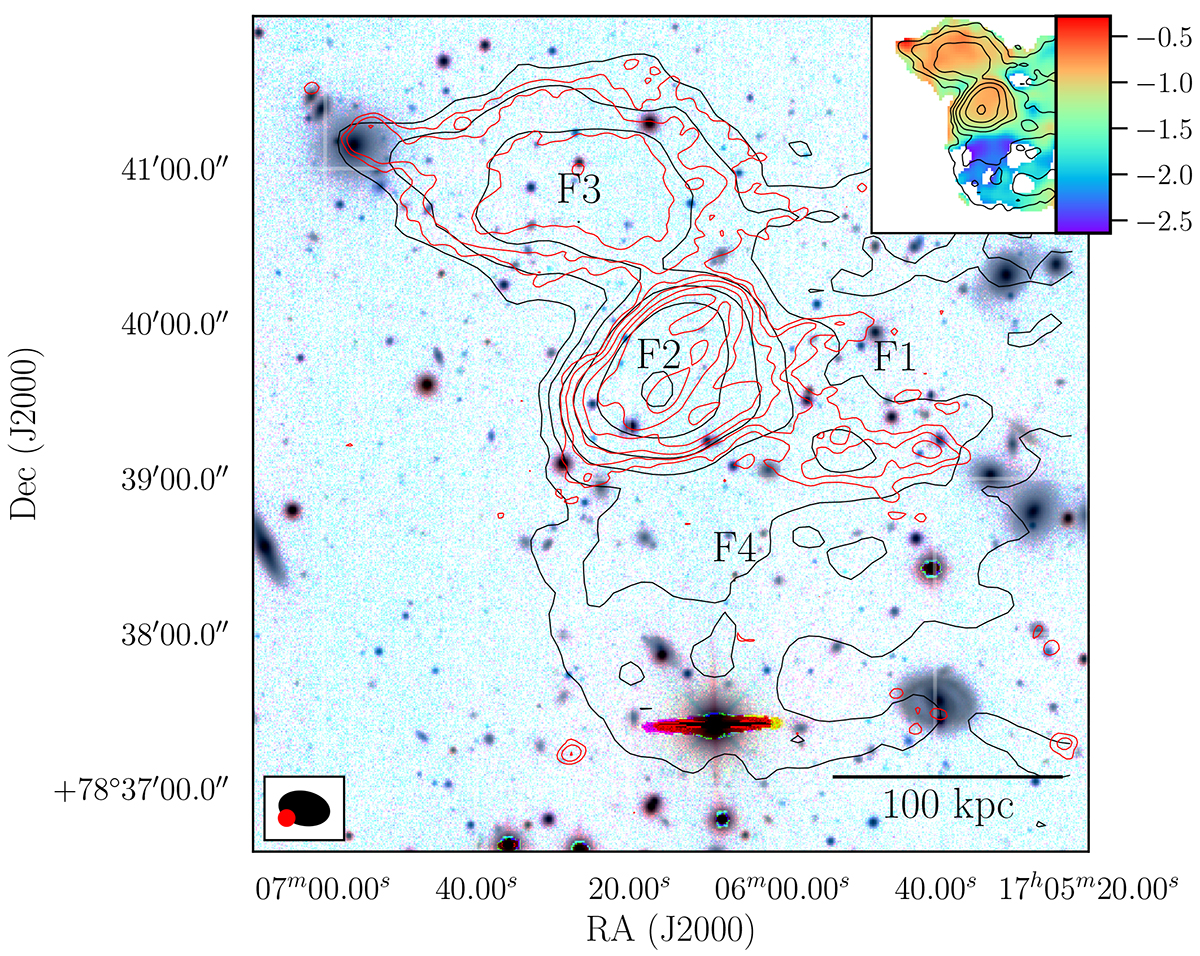
F-complex in Abell 2256, shown as the overlay of LOFAR 144 MHz 6″ (red) and LOFAR 46 MHz 19″ (black) contours on the grz optical filters from the Legacy Survey (Dey et al. 2019), with inverted colours for visibility. The restoring beams are indicated in the lower left corner, and contours are drawn at [5, 10, 20, 40] times the background noise level σ. The inset plot shows the spectral index map between 46 and 144 MHz at the common 19″ resolution with the same LOFAR 46 MHz contours, where F4 is visible as the blue steep region of emission.
Current usage metrics show cumulative count of Article Views (full-text article views including HTML views, PDF and ePub downloads, according to the available data) and Abstracts Views on Vision4Press platform.
Data correspond to usage on the plateform after 2015. The current usage metrics is available 48-96 hours after online publication and is updated daily on week days.
Initial download of the metrics may take a while.