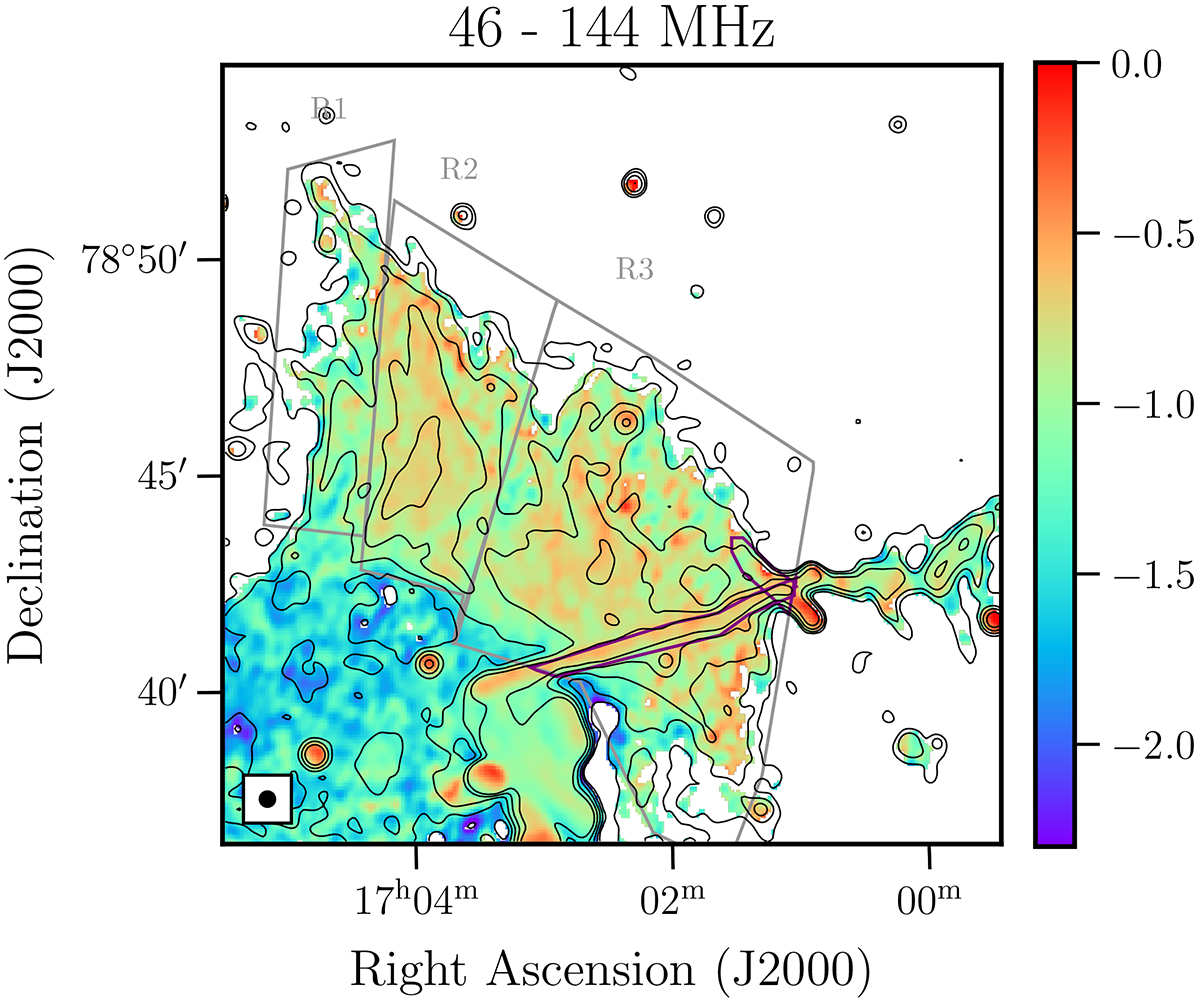
Fig. 10.
Download original image
Spectral index map of the radio shock between 46 and 144 MHz made at a common resolution of 20″ × 20″. The three regions used to compute the integrated spectral index of the shock are shown in grey, where the contribution from the bright narrow-angle-tailed sources is subtracted, shown in purple. The contours indicate the LOFAR 144 MHz total intensity at [3, 6, 12, 24, 48] times the background noise.
Current usage metrics show cumulative count of Article Views (full-text article views including HTML views, PDF and ePub downloads, according to the available data) and Abstracts Views on Vision4Press platform.
Data correspond to usage on the plateform after 2015. The current usage metrics is available 48-96 hours after online publication and is updated daily on week days.
Initial download of the metrics may take a while.