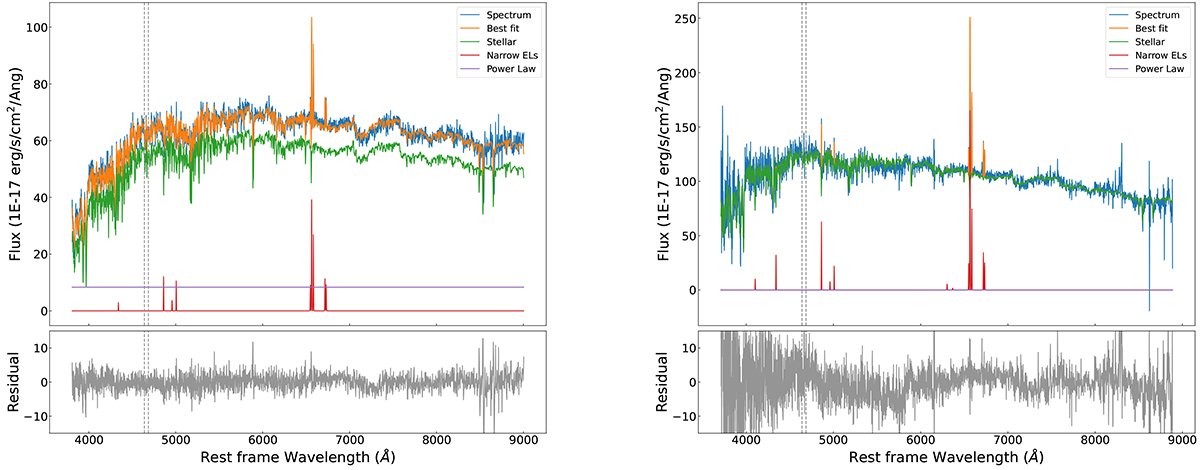
Fig. A.1.
Download original image
Spectral modelling of the 2007 SDSS spectrum (MJD 54156; left) and of the 2015 LAMOST spectrum (MJD 57155; right). Top: The original spectrum is shown in blue, the best fit (including all the components) in orange, the stellar component in green, the NELs in red, and the power law component in purple. Bottom: The modelling residual is shown in grey. In both panels, the grey dashed lines show the location of the N III λ4640 and the He II λ4686 emission lines.
Current usage metrics show cumulative count of Article Views (full-text article views including HTML views, PDF and ePub downloads, according to the available data) and Abstracts Views on Vision4Press platform.
Data correspond to usage on the plateform after 2015. The current usage metrics is available 48-96 hours after online publication and is updated daily on week days.
Initial download of the metrics may take a while.