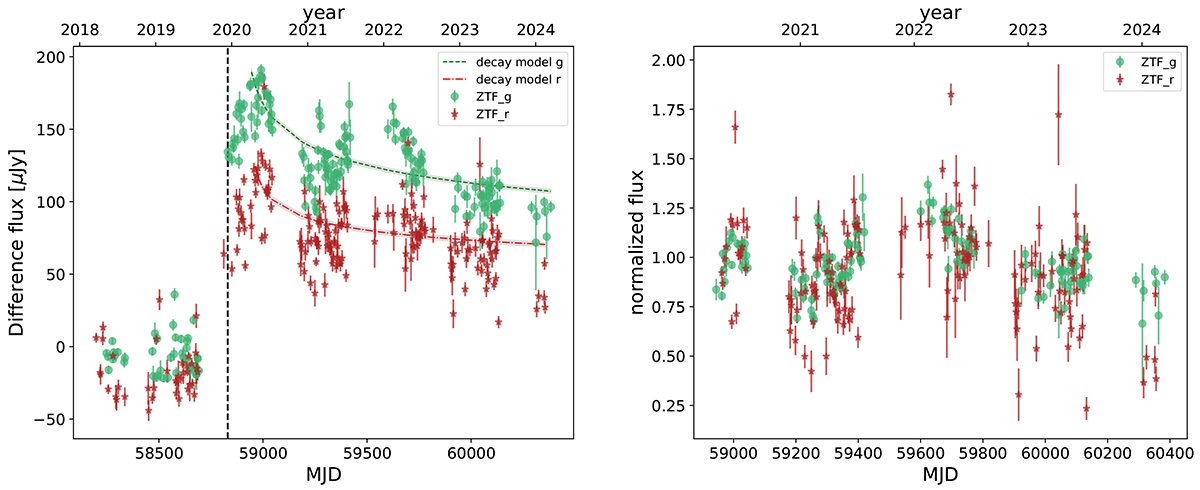
Fig. 1.
Download original image
ZTF light curves of SDSS1335+0728. Left: ZTF forced photometry light curve at the position of SDSS1335+0728 in the g (green circles) and r (red stars) bands. The light curves have been binned using a bin of three days. The black dashed line marks the day when SDSS1335+0728 started triggering alerts in the ZTF alert stream. The green and red dashed lines show the results of the power-law decay fit (with their respective uncertainties shown in light grey). We obtain power-law indices p of −0.17 ± 0.03 and −0.14 ± 0.03 in the g and r bands, respectively. Right: g (green), and r (red) band light curves obtained after normalising by the power-law decay fit.
Current usage metrics show cumulative count of Article Views (full-text article views including HTML views, PDF and ePub downloads, according to the available data) and Abstracts Views on Vision4Press platform.
Data correspond to usage on the plateform after 2015. The current usage metrics is available 48-96 hours after online publication and is updated daily on week days.
Initial download of the metrics may take a while.