Open Access
Fig. 9
Download original image
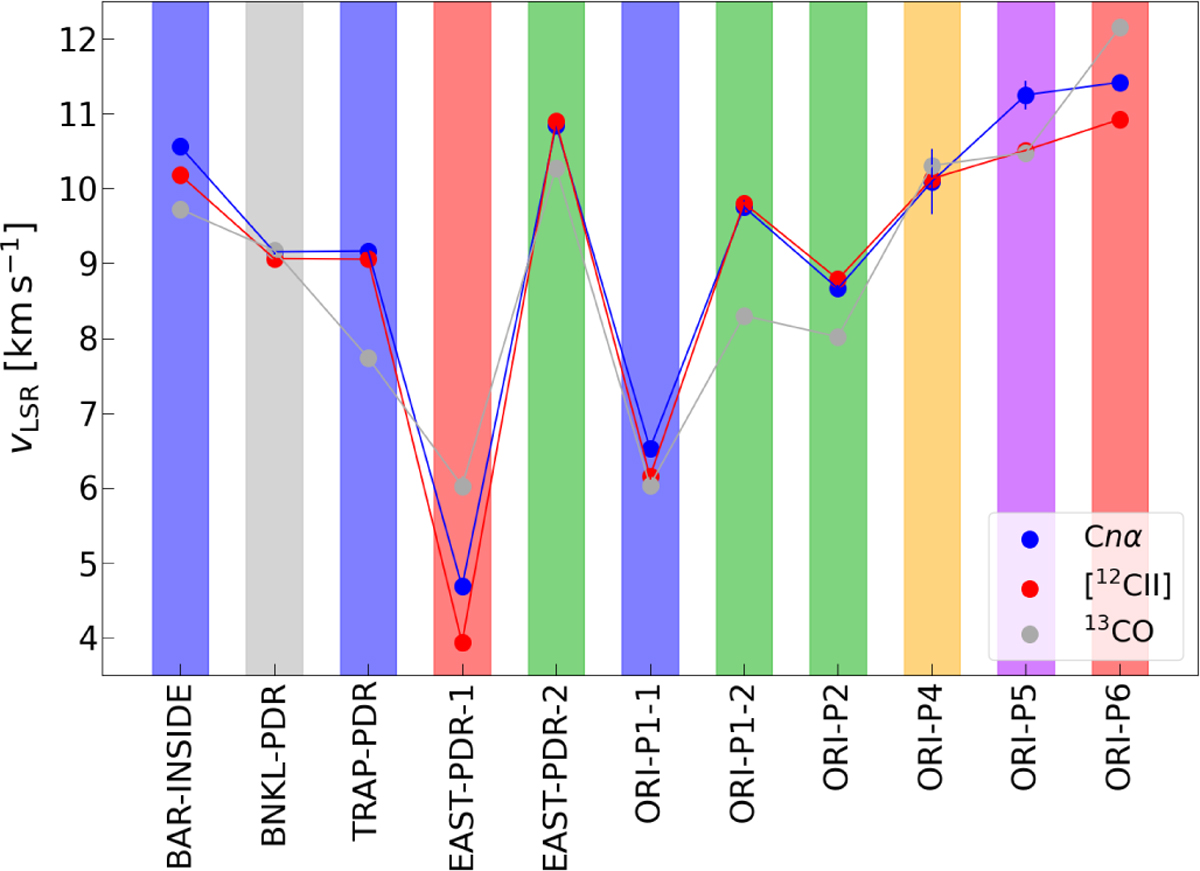
Peak velocities in the observed positions of the [C II], Cnα, and 13CO lines obtained from Gaussian fits. The background shading indicates the velocity-ordering class, defined in the main text, the position and component belongs to: red is class 1, green is class 2, blue is class 3, yellow is class 4, and purple is class 5.
Current usage metrics show cumulative count of Article Views (full-text article views including HTML views, PDF and ePub downloads, according to the available data) and Abstracts Views on Vision4Press platform.
Data correspond to usage on the plateform after 2015. The current usage metrics is available 48-96 hours after online publication and is updated daily on week days.
Initial download of the metrics may take a while.