Fig. 8.
Download original image
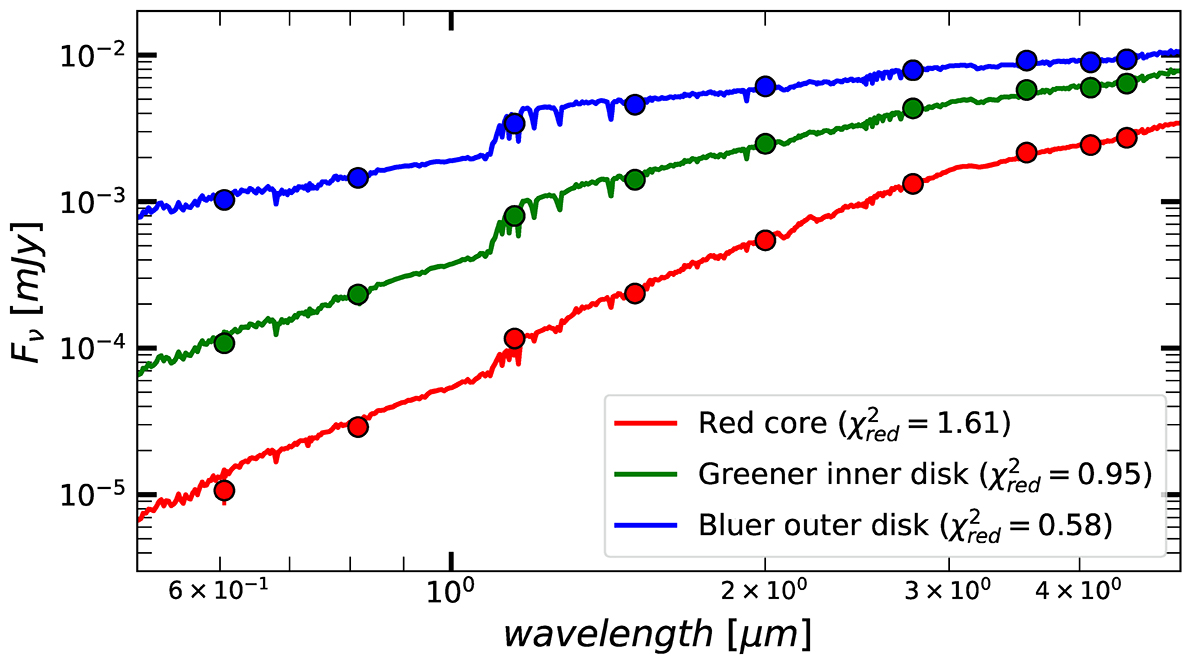
Best SED models computed by CIGALE (Boquien et al. 2019) for the red core (red line), the blue disk (blue line), and the intermediate region (green line) of the DSFG ID15371 at zspec = 1.921 (the same example galaxy shown in Figs. 5 and 7). We show in the legend the value of the reduced χ2 (![]() ) for each SED fit. The dots are the flux measurements from HST/ACS and JWST/NIRCam.
) for each SED fit. The dots are the flux measurements from HST/ACS and JWST/NIRCam.
Current usage metrics show cumulative count of Article Views (full-text article views including HTML views, PDF and ePub downloads, according to the available data) and Abstracts Views on Vision4Press platform.
Data correspond to usage on the plateform after 2015. The current usage metrics is available 48-96 hours after online publication and is updated daily on week days.
Initial download of the metrics may take a while.