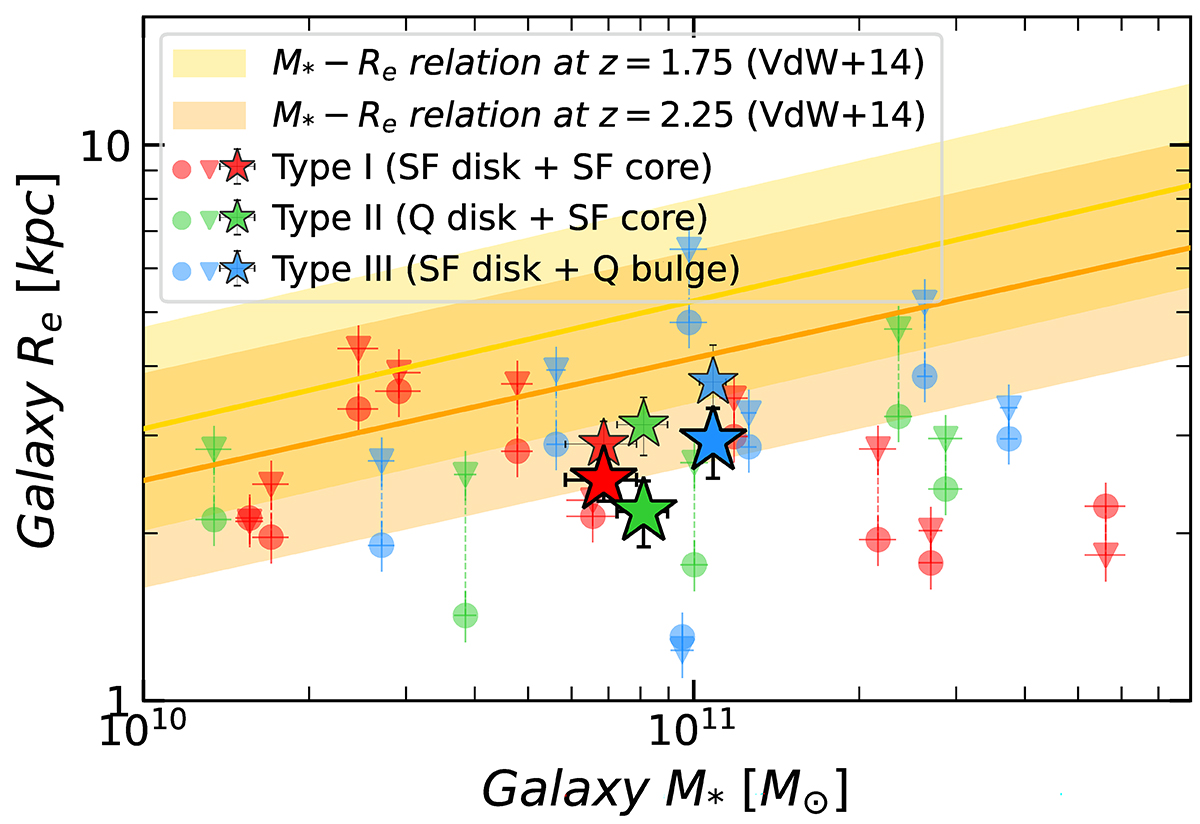
Fig. 16.
Download original image
Optical (triangle and smaller star markers) and near-IR (circle and larger star markers) half-light radius measured in the closest band to 550 nm and 1.6 μm rest-frame, respectively, versus the total M* of the galaxy. Circular and triangular markers are individual galaxies, star markers are the mean value for each Type of galaxy with their associated error bar indicating the error of the mean. For each individual galaxy, we link their optical (triangles) and NIR sizes (circles) by a dashed line to illustrates the size evolution. The yellow and orange shaded regions illustrate the mass-size relation derived by van der Wel et al. (2014) in the optical bands and at the redshift of our sample.
Current usage metrics show cumulative count of Article Views (full-text article views including HTML views, PDF and ePub downloads, according to the available data) and Abstracts Views on Vision4Press platform.
Data correspond to usage on the plateform after 2015. The current usage metrics is available 48-96 hours after online publication and is updated daily on week days.
Initial download of the metrics may take a while.