Open Access
Fig. 6
Download original image
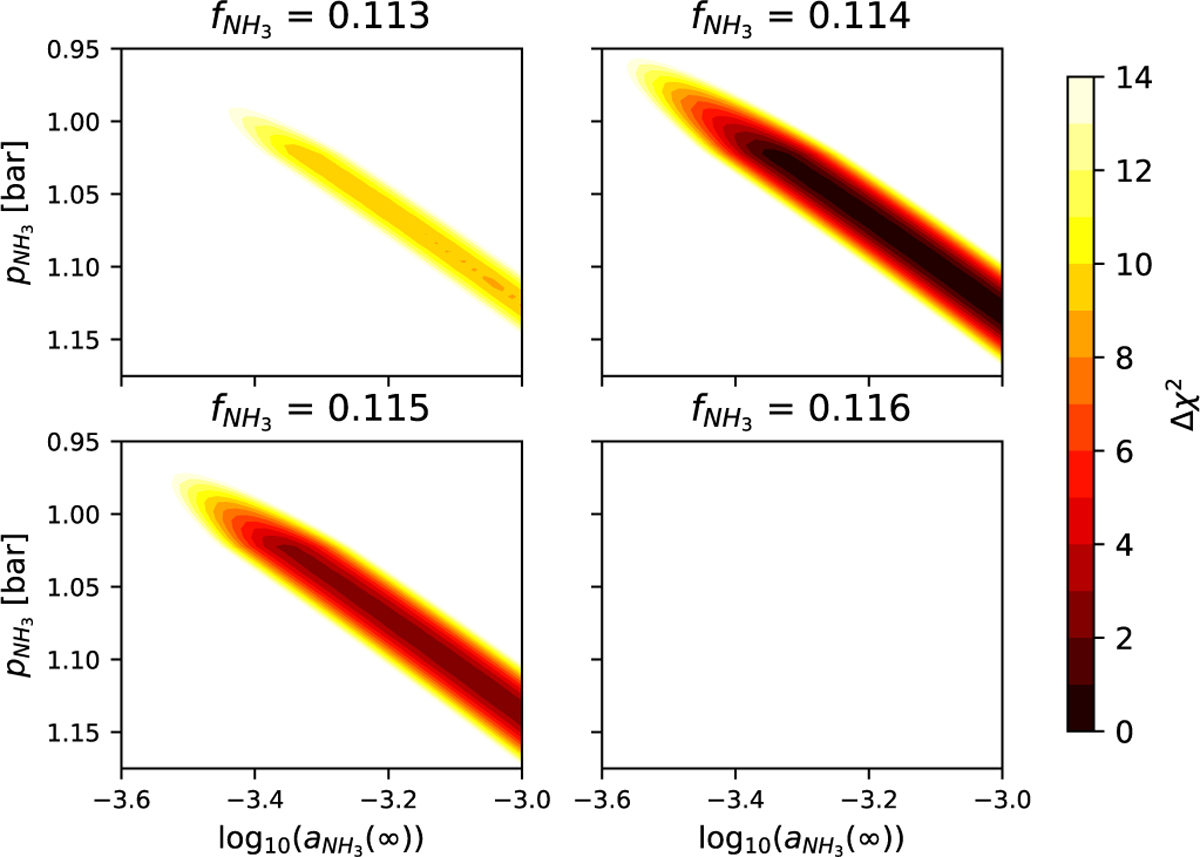
Least-squares comparison between the PACS data of the NH3 R(2), R(5), and R(7) bands and the model spectra synthesized using grids of ammonia abundance profiles expressed in ∆χ2 (see Eq. (5)).
Current usage metrics show cumulative count of Article Views (full-text article views including HTML views, PDF and ePub downloads, according to the available data) and Abstracts Views on Vision4Press platform.
Data correspond to usage on the plateform after 2015. The current usage metrics is available 48-96 hours after online publication and is updated daily on week days.
Initial download of the metrics may take a while.