Fig. 3
Download original image
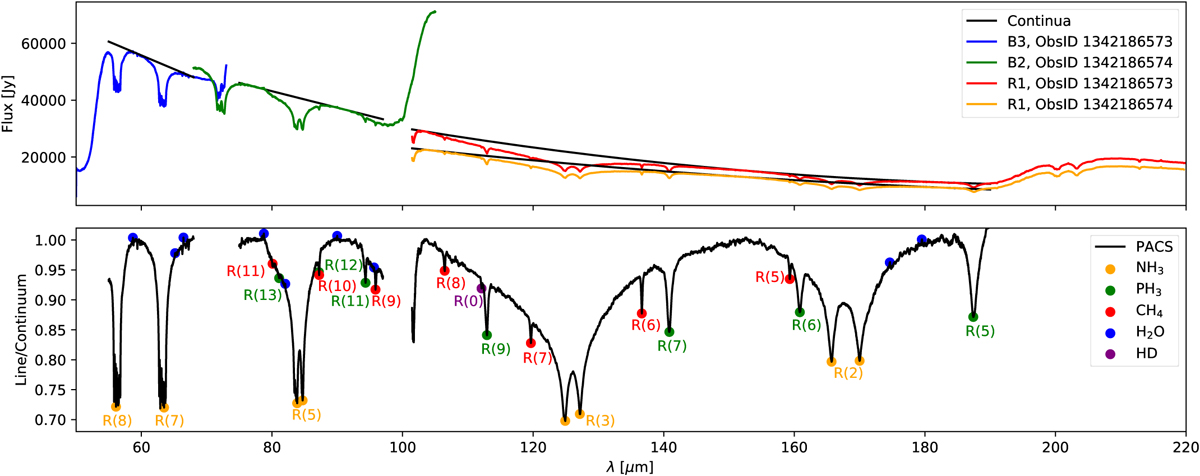
PACS spectra of Jupiter, averaged over the nine innermost spaxels. Upper panel: the absolute fluxes are shown using colored solid lines and the polynomials used to approximate the continua of each spectral band are depicted using black solid lines. The polynomials’ coefficients are listed in Table 2. Lower panel: the observations expressed in line-to-continuum ratios are plotted using black solid lines with the identified spectral features indicated with colored dots and the respective molecule’s rotational line transition. The parts of the data that are affected by spectral leakage are not shown in this panel. The data at wavelengths longer than 100 µm are the average of the two measurements in the R1 spectral band after normalization by the respective continua.
Current usage metrics show cumulative count of Article Views (full-text article views including HTML views, PDF and ePub downloads, according to the available data) and Abstracts Views on Vision4Press platform.
Data correspond to usage on the plateform after 2015. The current usage metrics is available 48-96 hours after online publication and is updated daily on week days.
Initial download of the metrics may take a while.