Fig. A.1
Download original image
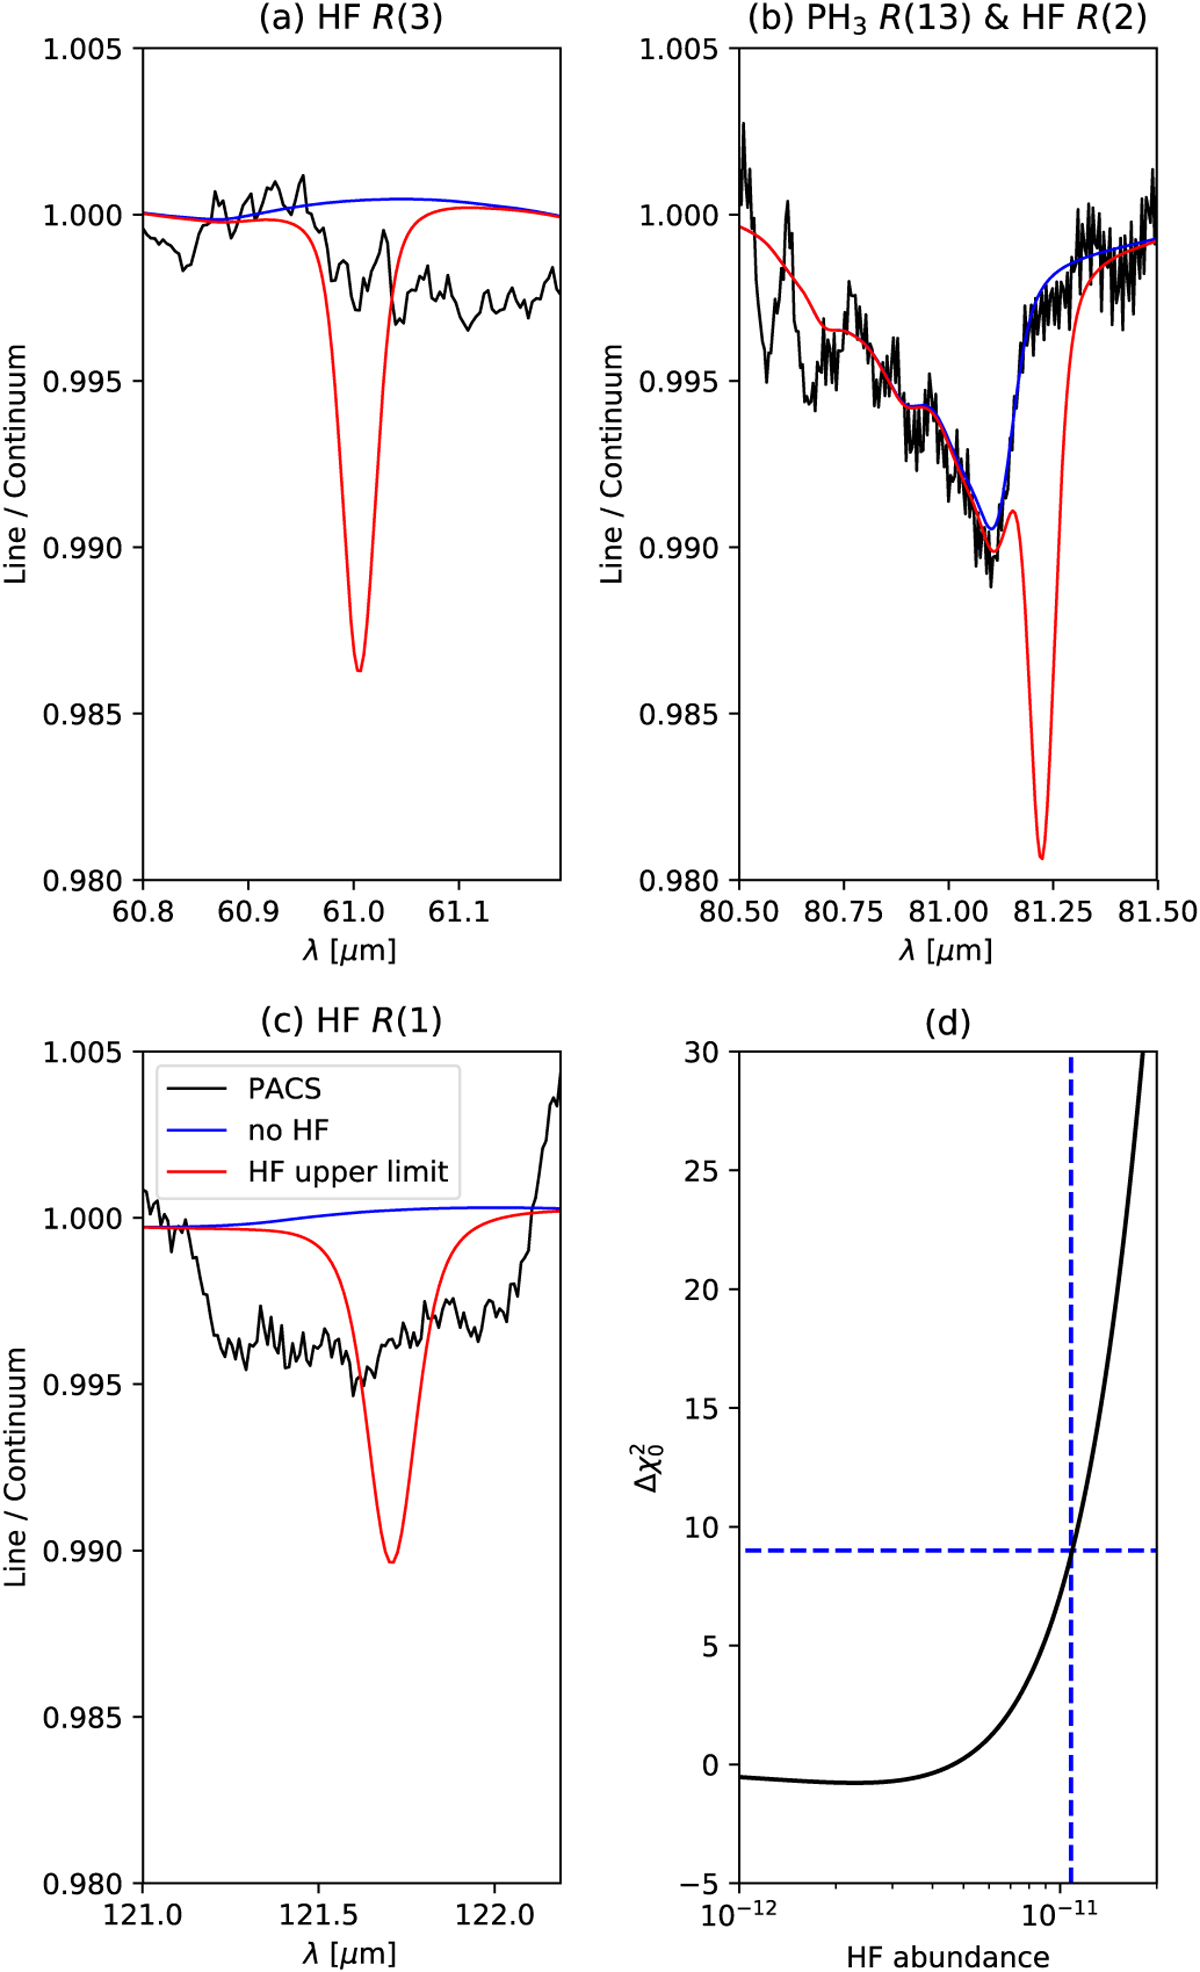
Results of the upper limit determination of Jupiter’s atmospheric hydrogen fluoride (HF) mole fraction using the PACS data and the a priori forward model (Sec. 3) including the derived ammonia and phosphine profiles (Subsec. 5.1 and 5.2) and the inferred methane mole fraction (Subsec. 5.3). Panels (a) to (c) show the PACS data around the wavelengths of three HF lines in the PACS spectral range. These plots also show forward model spectra including HF with the inferred upper limit mole fraction and without HF at all. Panel (d) shows the results of the least-squares comparison between model spectra assuming different HF mole fractions and the PACS data using ![]() (see Equation 4). The criterion for the upper limit
(see Equation 4). The criterion for the upper limit ![]() is shown with a horizontal blue dashed line and the mole fraction at which it is met is shown using a vertical blue dashed line. In total, 1000 values for the HF mole fraction between 0 and 1 × 10⁻⁹ were used in the forward model to compare the resulting model spectra with the PACS data.
is shown with a horizontal blue dashed line and the mole fraction at which it is met is shown using a vertical blue dashed line. In total, 1000 values for the HF mole fraction between 0 and 1 × 10⁻⁹ were used in the forward model to compare the resulting model spectra with the PACS data.
Current usage metrics show cumulative count of Article Views (full-text article views including HTML views, PDF and ePub downloads, according to the available data) and Abstracts Views on Vision4Press platform.
Data correspond to usage on the plateform after 2015. The current usage metrics is available 48-96 hours after online publication and is updated daily on week days.
Initial download of the metrics may take a while.