Fig. 2
Download original image
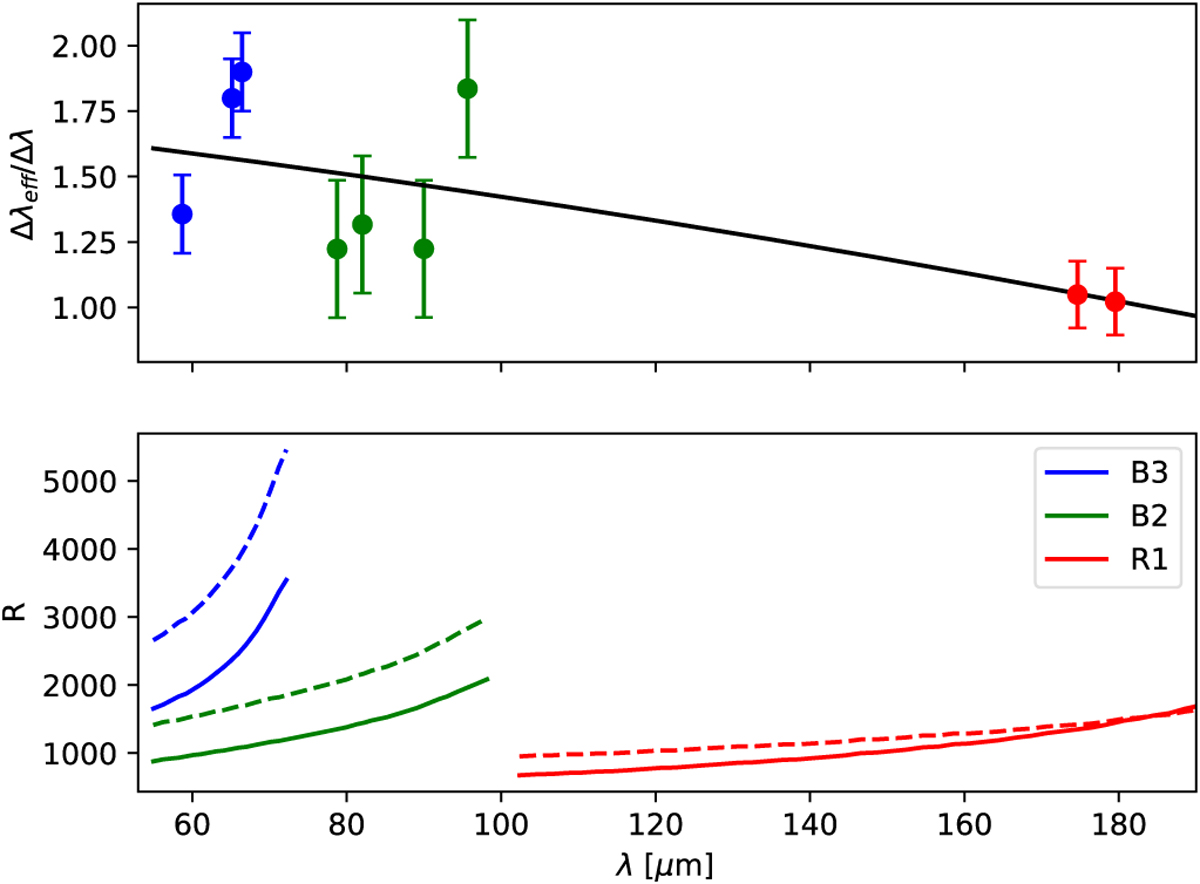
Determination of PACS’s effective spectral resolution R over its spectral range using water emission lines. Upper panel: the colored dots show the ratios of the effective resolvable difference in wavelength and the resolvable difference in wavelength given by PACS’s spectral resolution for point sources determined from the detected water emission lines. The dots are color-coded by PACS’s spectral band they fall into. The solid black line shows a second-order polynomial fit to the data. Lower panel: PACS’s resolution for point sources in each spectral band, as given in the observer’s manual (ESA 2013) is shown using dashed lines, and the effective spectral resolution of the Jupiter observations as determined from the polynomial fit is plotted using solid lines.
Current usage metrics show cumulative count of Article Views (full-text article views including HTML views, PDF and ePub downloads, according to the available data) and Abstracts Views on Vision4Press platform.
Data correspond to usage on the plateform after 2015. The current usage metrics is available 48-96 hours after online publication and is updated daily on week days.
Initial download of the metrics may take a while.