Fig. 17
Download original image
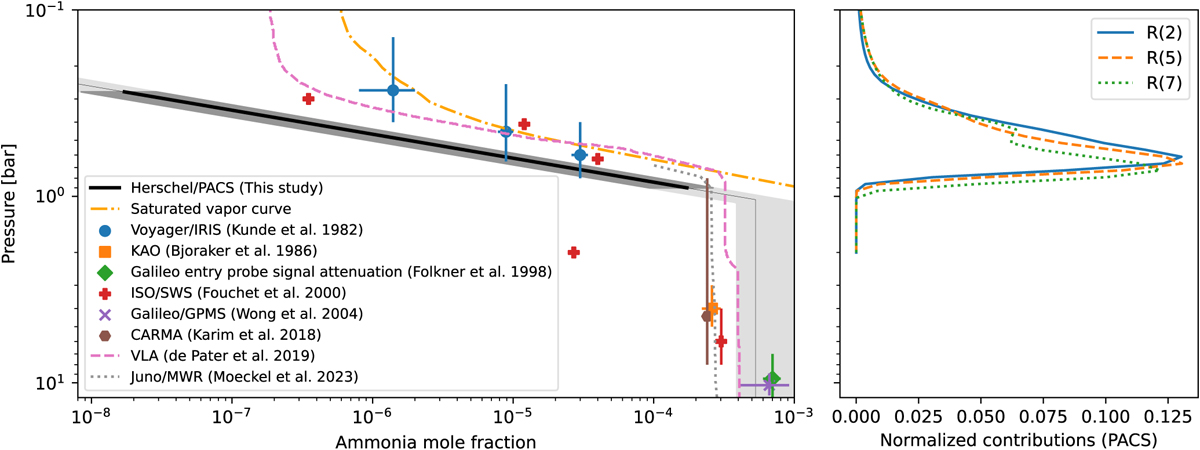
Ammonia mole fractions inferred from the PACS observations along with the results of previous studies, the saturated vapor curve, and the normalized contribution functions derived from our data analysis. Left panel: thin solid line depicts the ammonia abundance profile derived from the PACS observations with light gray shading indicating the 1σ uncertainty range. The thick line segment with dark gray shading indicates the pressure range in which at least one of the normalized contribution functions (right panel) is >0.02 and thus presents the pressure range the PACS data are approximately sensitive to. The dash-dotted line represents the saturated vapor curve for ammonia calculated using Eq. (8) and adopting our pressure-temperature profile. The colored data points represent results of previous studies with reported uncertainties and probed pressure levels indicated using horizontal and vertical errorbars, respectively. Right panel: normalized contribution functions integrated over the wavelength ranges of the five rotational bands used simultaneously to analyze the ammonia mole fractions in Jupiter using the PACS observations.
Current usage metrics show cumulative count of Article Views (full-text article views including HTML views, PDF and ePub downloads, according to the available data) and Abstracts Views on Vision4Press platform.
Data correspond to usage on the plateform after 2015. The current usage metrics is available 48-96 hours after online publication and is updated daily on week days.
Initial download of the metrics may take a while.