Fig. 15
Download original image
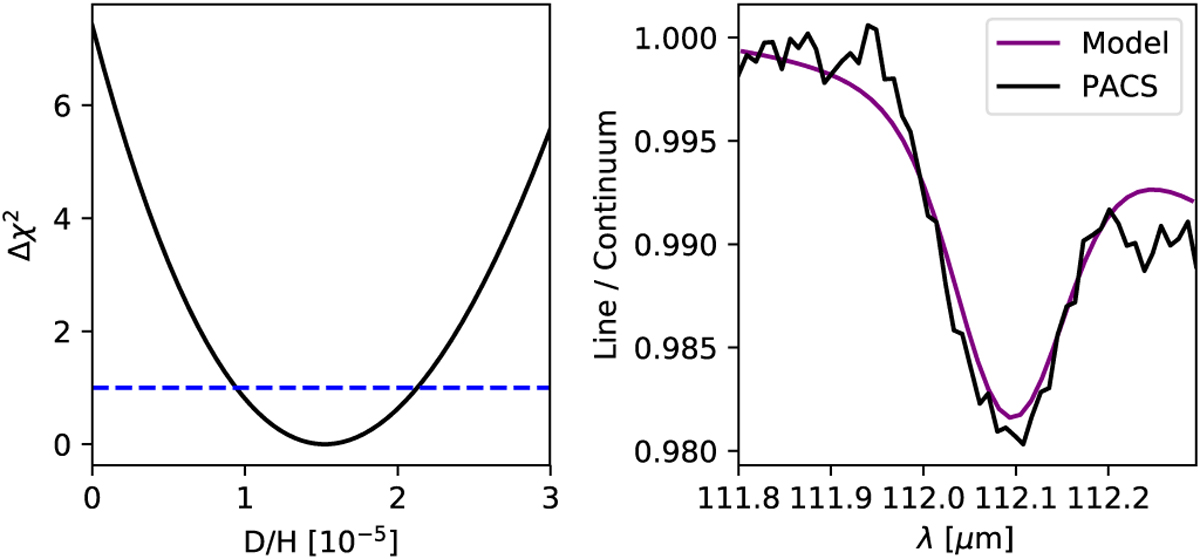
Results of the analysis of deuterated hydrogen. Left panel: least-squares results between the model spectra assuming a range of D/H ratios and the PACS data expressed in ∆χ−2 (Eq. (5)) are plotted using a solid black line. The dashed blue line shows the 1σ confidence interval. Right panel: model spectrum using D/H = 1.5 × 10⁻⁵ andthePACS data of the HD R(0) line.
Current usage metrics show cumulative count of Article Views (full-text article views including HTML views, PDF and ePub downloads, according to the available data) and Abstracts Views on Vision4Press platform.
Data correspond to usage on the plateform after 2015. The current usage metrics is available 48-96 hours after online publication and is updated daily on week days.
Initial download of the metrics may take a while.