Fig. 1
Download original image
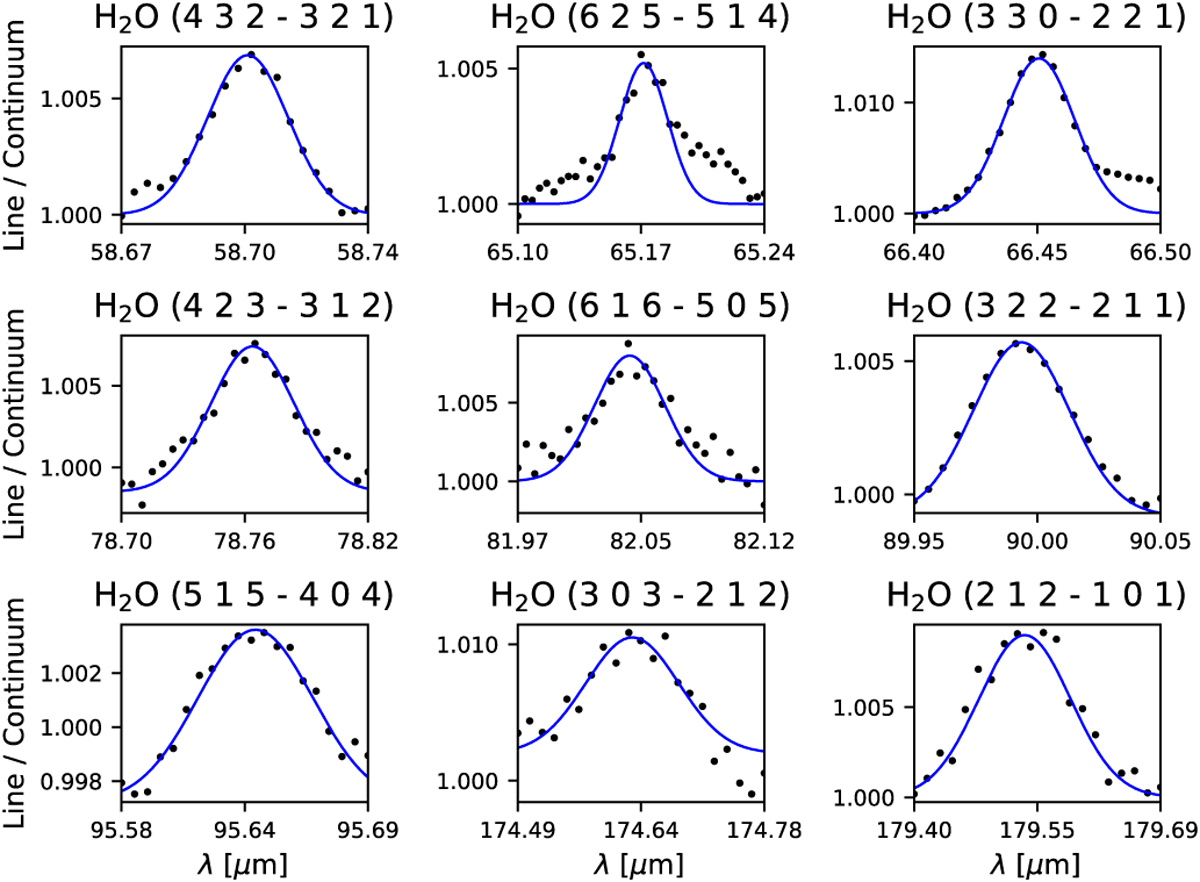
Confirmed emission lines caused by the presence of water vapor in the upper Jovian stratosphere. The PACS measurements are shown with black dots and the Gaussians fit to the data to obtain the FWHM of the lines are plotted using blue lines. The rotational transitions that cause the lines are given in the panels’ titles using the three rotational quantum numbers of the upper and lower states, respectively.
Current usage metrics show cumulative count of Article Views (full-text article views including HTML views, PDF and ePub downloads, according to the available data) and Abstracts Views on Vision4Press platform.
Data correspond to usage on the plateform after 2015. The current usage metrics is available 48-96 hours after online publication and is updated daily on week days.
Initial download of the metrics may take a while.