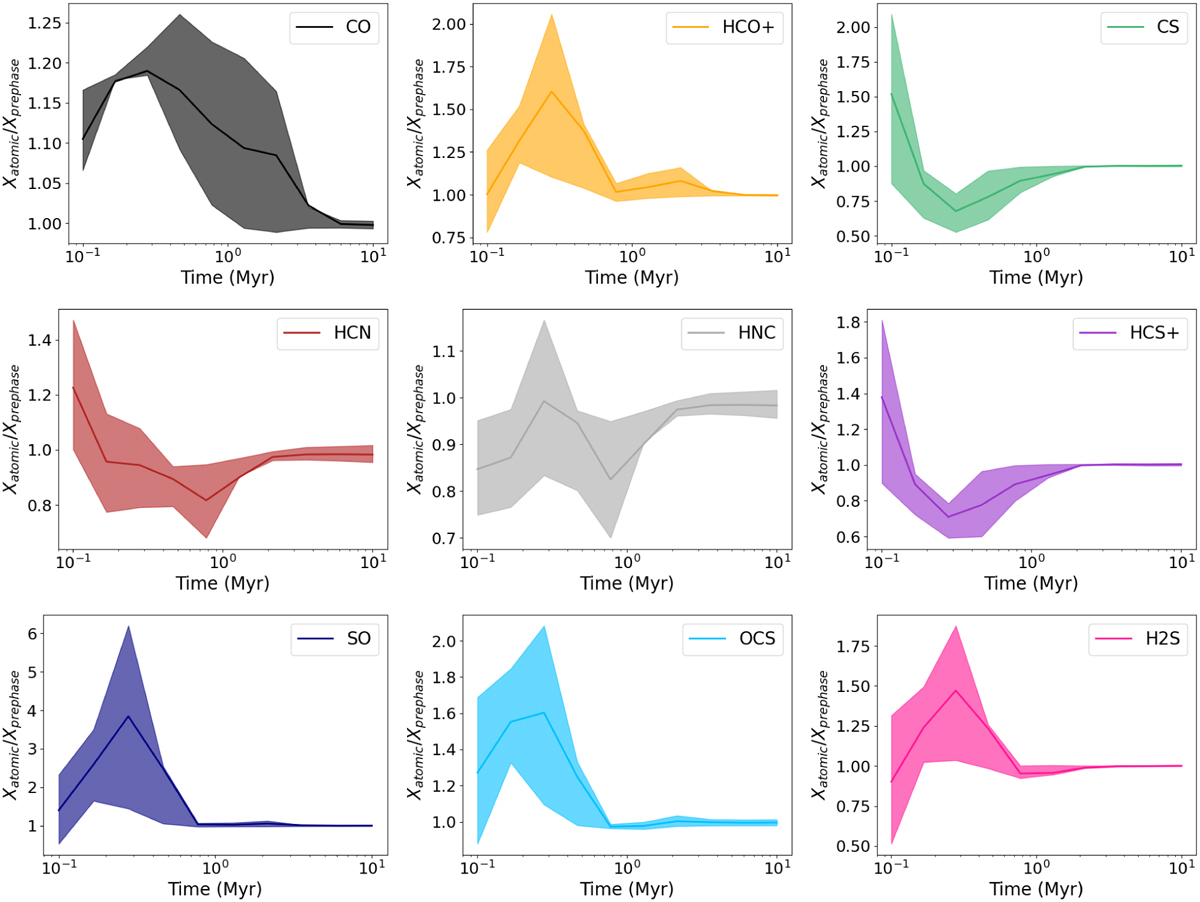
Fig. A.2
Download original image
Time evolution of the ratio between the abundances predicted by the model that considers initial atomic abundances (main paper) and the abundances as given by the pre-phase model (this section). The solid line represents the mean ratio, while the shaded area delimits the interquartile range. For generating these plots, we only considered density values between percentiles 1.5% and 98.5% of the density PDF analysed in the main core of the paper, which roughly corresponds to nH = 1.40 × 104 cm−3 and nH = 1.20 × 105 cm−3.
Current usage metrics show cumulative count of Article Views (full-text article views including HTML views, PDF and ePub downloads, according to the available data) and Abstracts Views on Vision4Press platform.
Data correspond to usage on the plateform after 2015. The current usage metrics is available 48-96 hours after online publication and is updated daily on week days.
Initial download of the metrics may take a while.