Open Access
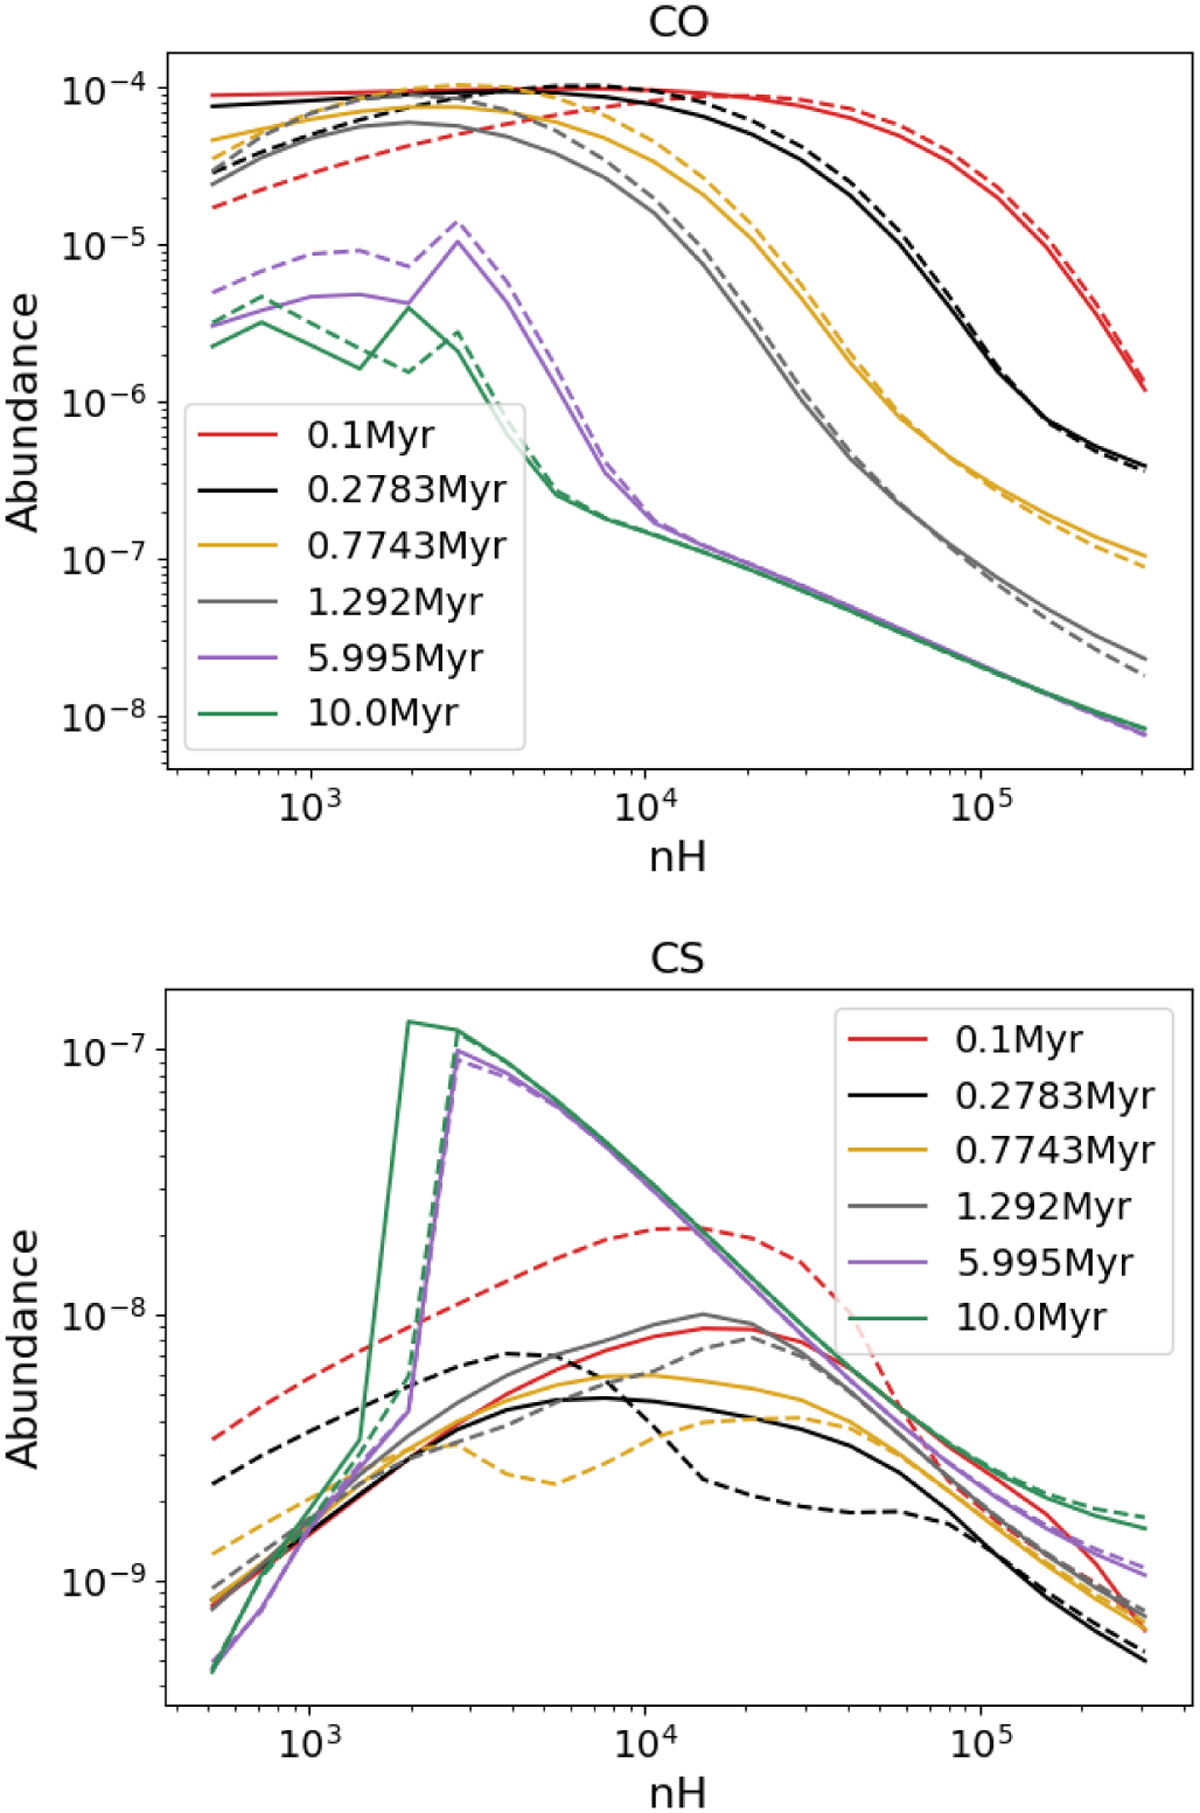
Fig. A.1
Download original image
Predicted abundances for CO (top) and CS (bottom) of the pre-phase model (solid lines) and the atomic model (dashed lines) over the density grid considered in this work. Different chemical ages are colour-coded as shown in the legend.
Current usage metrics show cumulative count of Article Views (full-text article views including HTML views, PDF and ePub downloads, according to the available data) and Abstracts Views on Vision4Press platform.
Data correspond to usage on the plateform after 2015. The current usage metrics is available 48-96 hours after online publication and is updated daily on week days.
Initial download of the metrics may take a while.