Fig. 6
Download original image
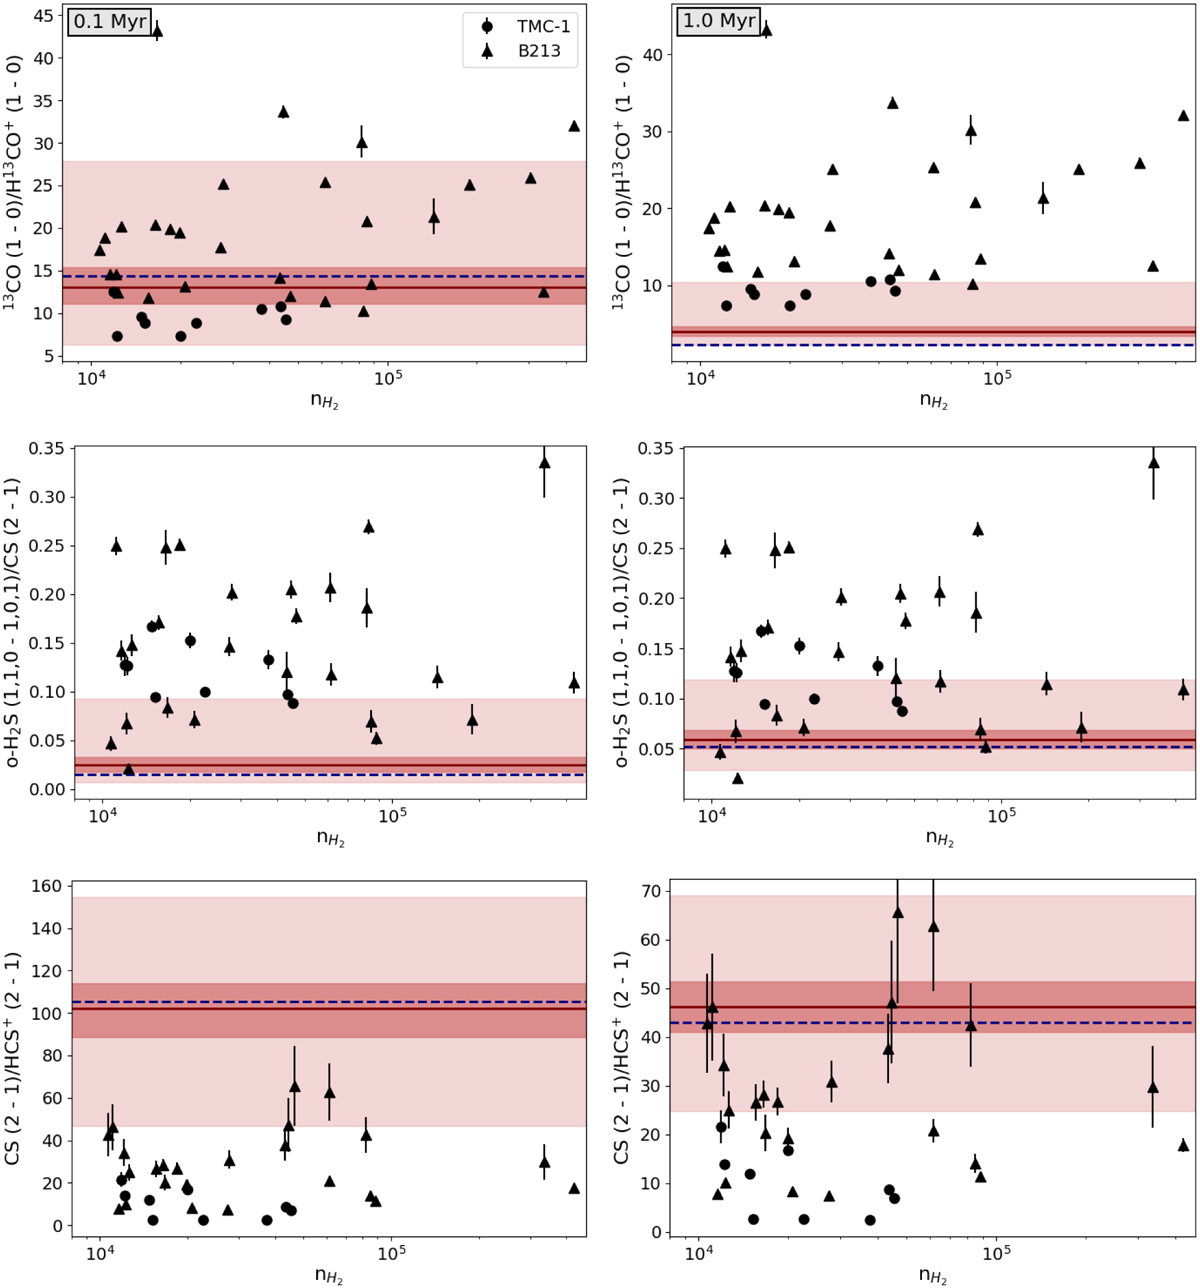
Comparison between predicted and observed values of the ratios 13CO (1 → 0)/H13CO+ (1 → 0), o-H2S (110 → 101)/CS (2 → 1), and CS (2 → 1)/HCS+ (2 → 1). The left panels correspond to the post-processed simulations at 0.1 Myr while the right panels correspond to 1.0 Myr. On each panel, the median value for the turbulent (uniform) case is highlighted by the solid (dashed) line, the IQR is represented by the dark area and the full range (from minimum to maximum) is represented by the light-coloured area. The uniform and turbulent cases are coded in blue and red, respectively. TMC-1 points are represented by circles and B213 by triangles, and error bars are always plotted although in most cases they are smaller than the marker. The error bars correspond to the statistical errors from fitting the lines and do not include systematics (GEMS IV).
Current usage metrics show cumulative count of Article Views (full-text article views including HTML views, PDF and ePub downloads, according to the available data) and Abstracts Views on Vision4Press platform.
Data correspond to usage on the plateform after 2015. The current usage metrics is available 48-96 hours after online publication and is updated daily on week days.
Initial download of the metrics may take a while.