Fig. 5
Download original image
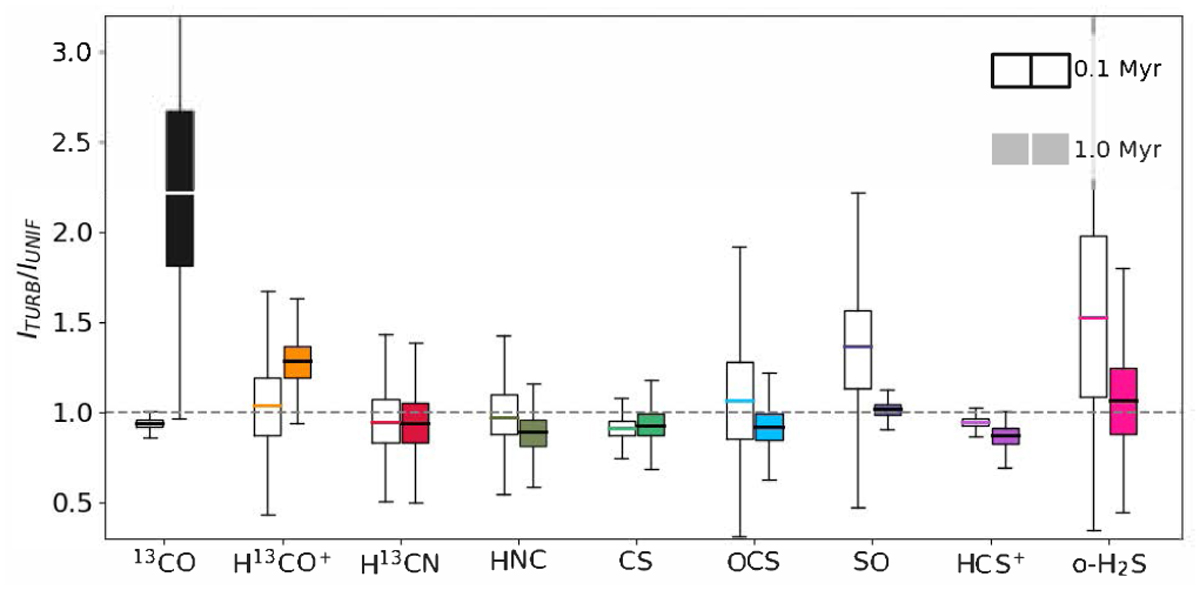
Box plot for the ratio of integrated intensity maps ITURB /IUNIF for the case of the magnetic field perpendicular to the line of sight, where ITURB is the integrated intensity map for the full post-processed simulation and IUNIF is the intensity map assuming a constant hydrogen density (and therefore constant molecular abundance) along the line of sight. For each molecule we have two box plots: the left one corresponds to the chemical network at 0.1 Myr, and the right one at 1 Myr. The y-axis has been scaled so that the main box ranging from quartiles Q1 (25%) to Q3 (75%) is always shown and differences among all molecules can be appreciated, although in some cases the whiskers extend outside the plot. This figure corresponds to the case where the line of sight is perpendicular to the mean magnetic field direction. An analogous figure for the line of sight parallel to the magnetic field is provided in Appendix D.
Current usage metrics show cumulative count of Article Views (full-text article views including HTML views, PDF and ePub downloads, according to the available data) and Abstracts Views on Vision4Press platform.
Data correspond to usage on the plateform after 2015. The current usage metrics is available 48-96 hours after online publication and is updated daily on week days.
Initial download of the metrics may take a while.