Fig. 4

Download original image
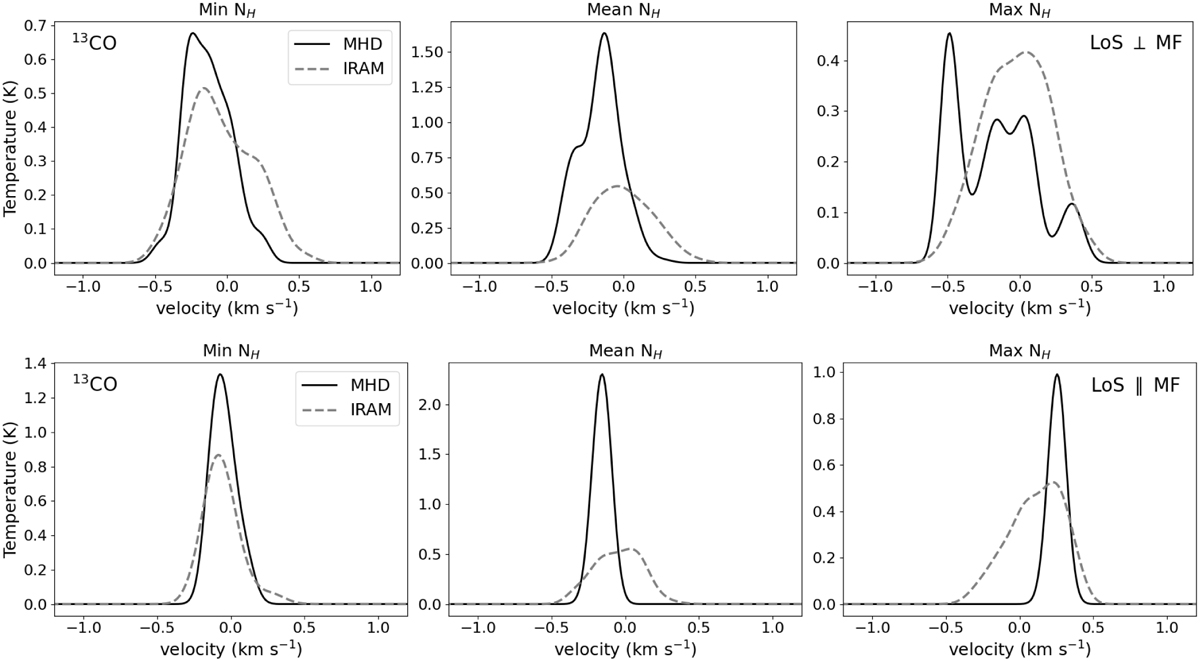
Line profiles predicted by RADMC-3D for 13CO (1 → 0) for two faces of the cube and three lines of sight. The solid black line corresponds to the post-processed simulation, which assuming a nominal distance of d = 140 pc corresponds to a scale of 0.28″ per cell; the dashed grey line corresponds to the line profile convolved to the IRAM 30 m resolution for the selected transition, which is 22.32″. The difference in velocity range for both the upper and lower panels, which corresponds to lines of sight perpendicular (xy plane, left panel in Fig. 3) and parallel to the magnetic field (yz plane, right panel in Fig. 3) respectively.
Current usage metrics show cumulative count of Article Views (full-text article views including HTML views, PDF and ePub downloads, according to the available data) and Abstracts Views on Vision4Press platform.
Data correspond to usage on the plateform after 2015. The current usage metrics is available 48-96 hours after online publication and is updated daily on week days.
Initial download of the metrics may take a while.


