Fig. 3
Download original image
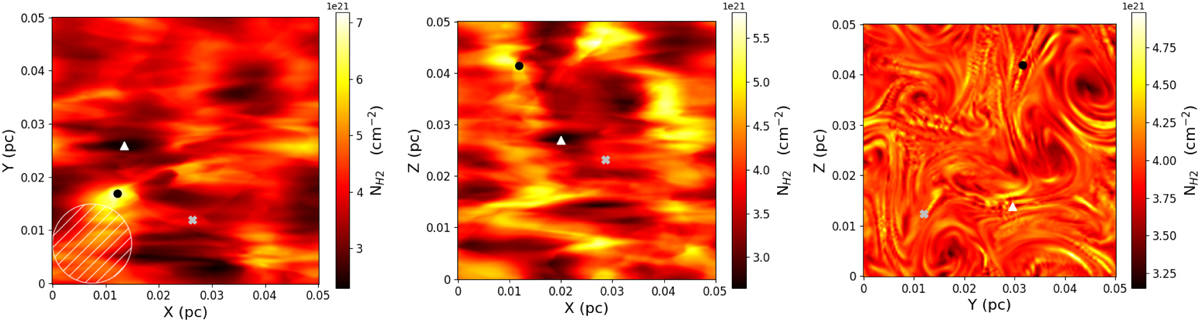
Molecular hydrogen column density maps for the three faces of the simulation before convolution. Depending on the plane chosen the value range varies slightly, being the yz plane the one with the less appreciable differences. In the first panel, a hatched white circle represents the IRAM 30 m beam efficiency for 13CO (1 → 0), which is the molecule used for the discussion of the kinematics. On each plot, the black circle represents the line of sight with the higher column density, the white triangle the one with lower column density, and the grey cross indicates the position where the column density is equal to the mean value (3.97 × 1021 cm−2), which corresponds to a line of sight with a mean particle density of ![]() . The maximum value of column density corresponds to an extinction value of AV ~ 4 mag, and the mean value is not unique: the fraction of the surface within the 10% of this value is ~45% in the xy plane, ~49% in the xz plane, and ~96% in the yz plane. These lines of sight have been chosen excluding the boundaries, so that when convolving with the beam highlighted in the first panel there is not any loss of information.
. The maximum value of column density corresponds to an extinction value of AV ~ 4 mag, and the mean value is not unique: the fraction of the surface within the 10% of this value is ~45% in the xy plane, ~49% in the xz plane, and ~96% in the yz plane. These lines of sight have been chosen excluding the boundaries, so that when convolving with the beam highlighted in the first panel there is not any loss of information.
Current usage metrics show cumulative count of Article Views (full-text article views including HTML views, PDF and ePub downloads, according to the available data) and Abstracts Views on Vision4Press platform.
Data correspond to usage on the plateform after 2015. The current usage metrics is available 48-96 hours after online publication and is updated daily on week days.
Initial download of the metrics may take a while.