Fig. 2
Download original image
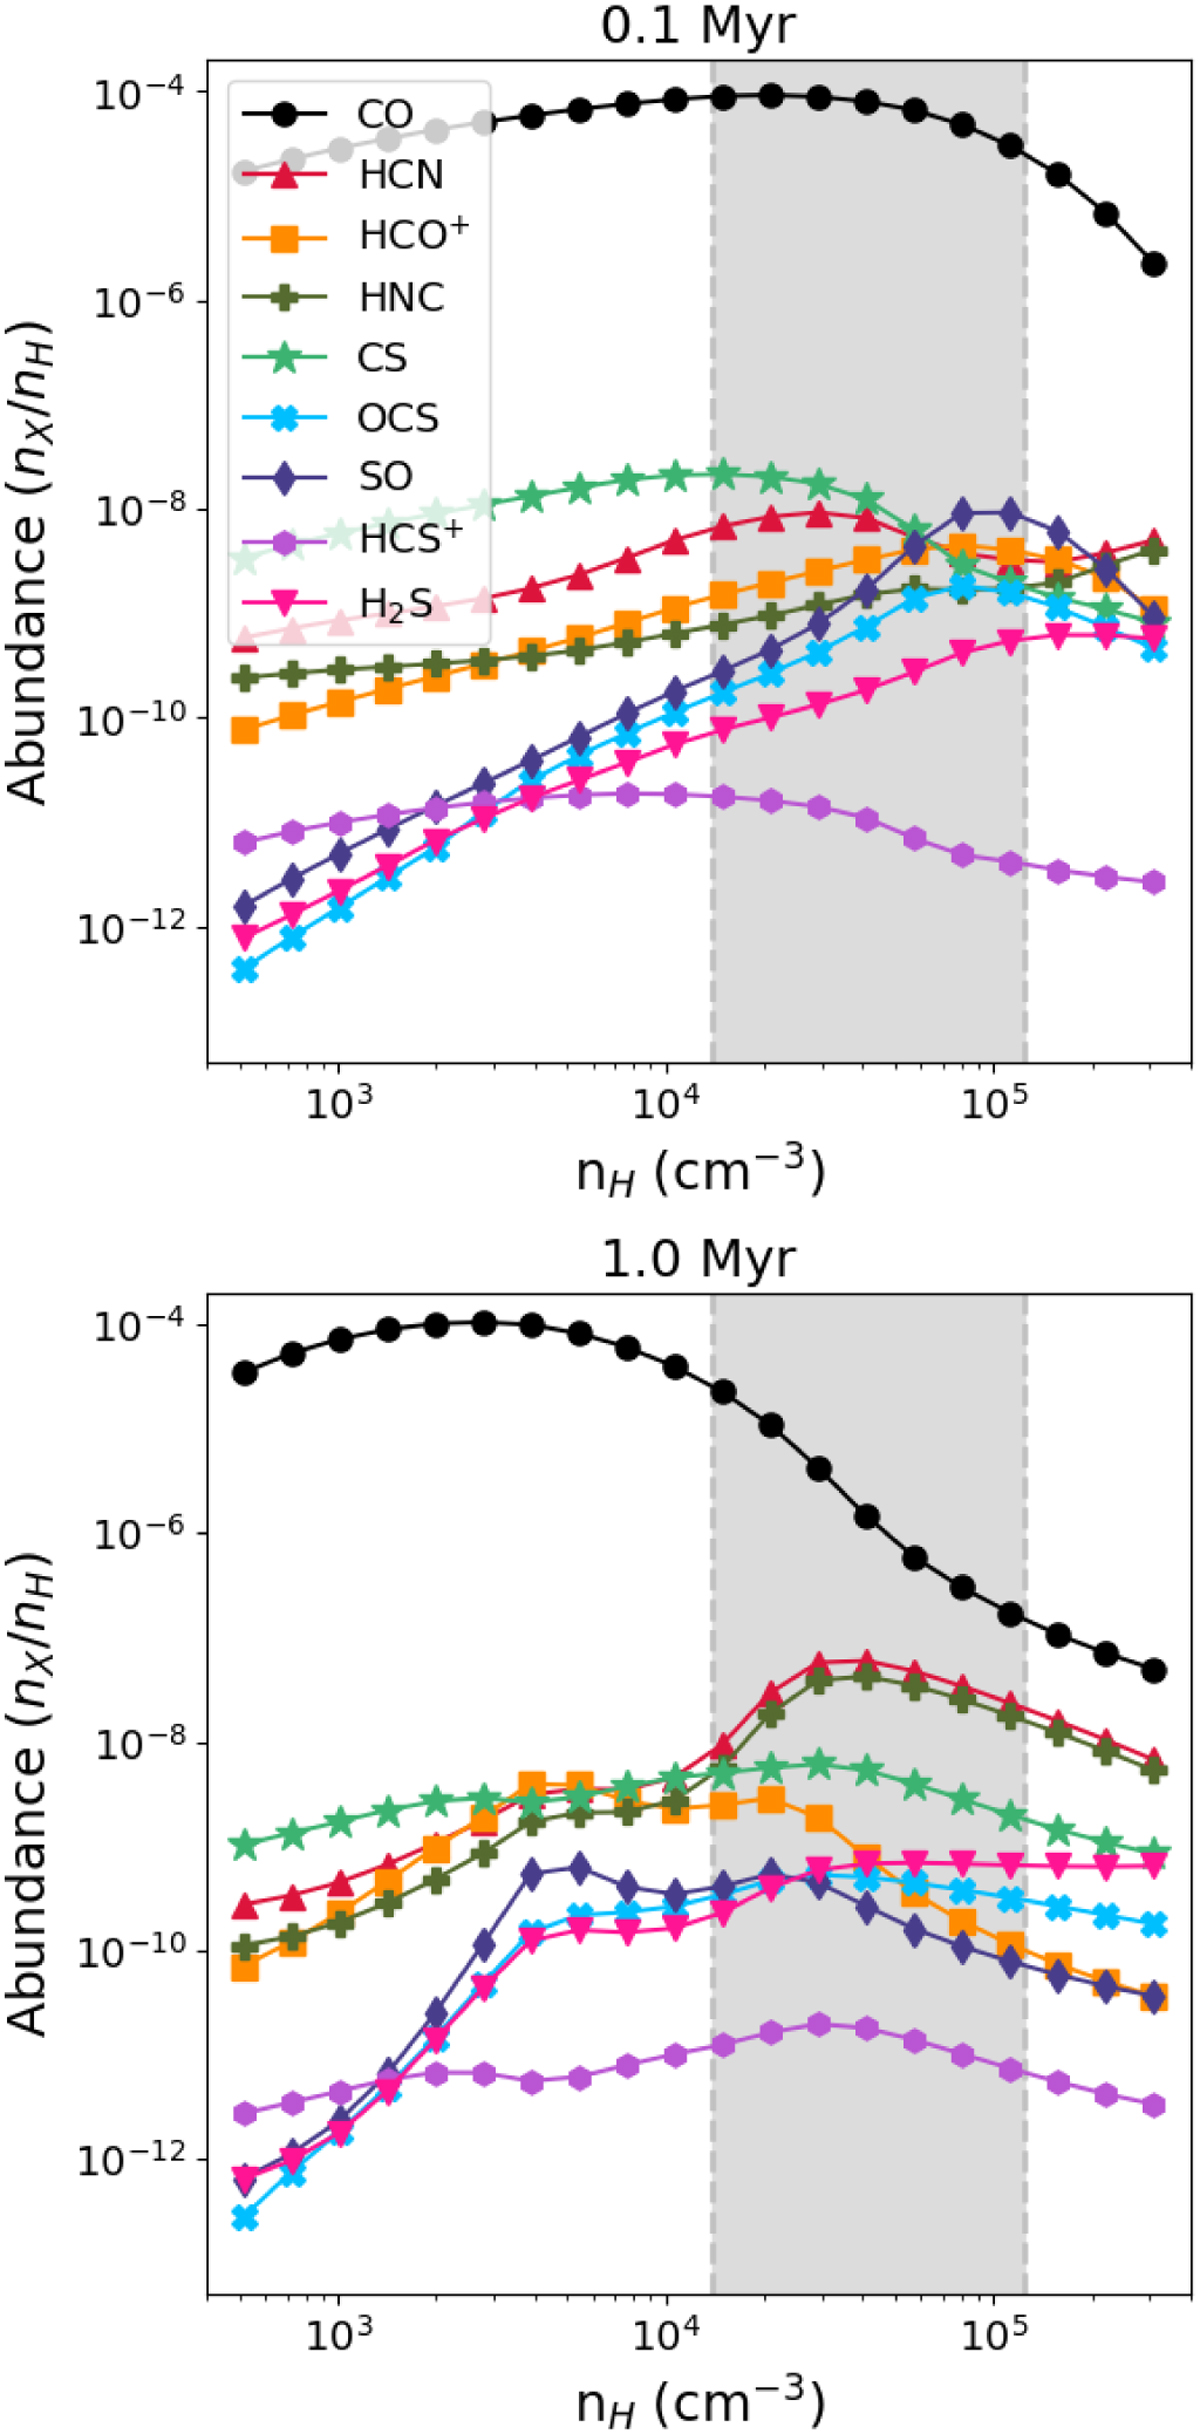
Chemical models computed with NAUTILUS for 0.1 Myr (top) and 1.0 Myr (bottom). The densities covered by the grids are defined so that the minimum and maximum values reached by the simulations are included. The shaded region in both plots corresponds to the density range P1.5 ≤ ρ ≤ P98.5, so most of the simulation cells (97%) are included in this interval.
Current usage metrics show cumulative count of Article Views (full-text article views including HTML views, PDF and ePub downloads, according to the available data) and Abstracts Views on Vision4Press platform.
Data correspond to usage on the plateform after 2015. The current usage metrics is available 48-96 hours after online publication and is updated daily on week days.
Initial download of the metrics may take a while.