Fig. C.1
Download original image
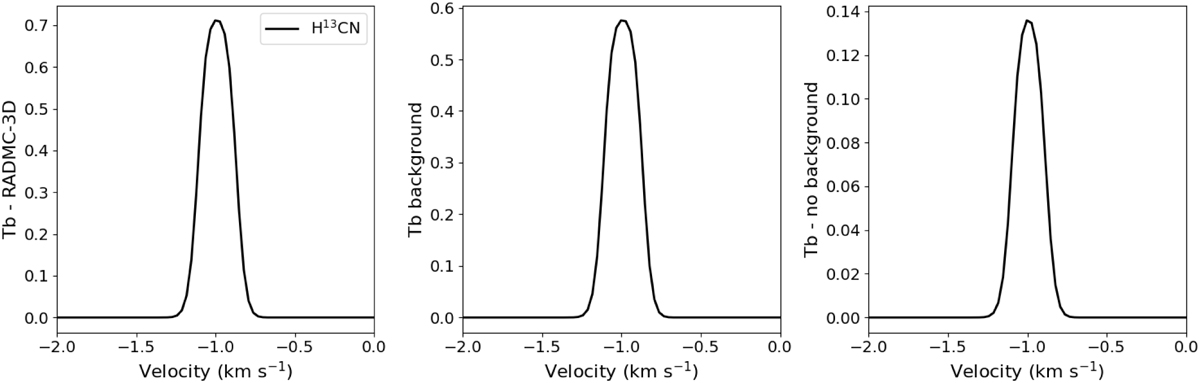
Comparison between line profiles. Left: line profile for H13CN (1 → 0) as given by RADMC-3D. Middle: line profile for the same setup than left panel, but setting the hydrogen density near to zero, and therefore corresponding to the background contribution. Right: resulting line profile when we substract the background (middle plot) to the RADMC-3D profile (left plot). Line profiles like the one on the right are those that we used for the analysis of H13CN (1 → 0) and H13CO+ (1 → 0).
Current usage metrics show cumulative count of Article Views (full-text article views including HTML views, PDF and ePub downloads, according to the available data) and Abstracts Views on Vision4Press platform.
Data correspond to usage on the plateform after 2015. The current usage metrics is available 48-96 hours after online publication and is updated daily on week days.
Initial download of the metrics may take a while.