Fig. 9.
Download original image
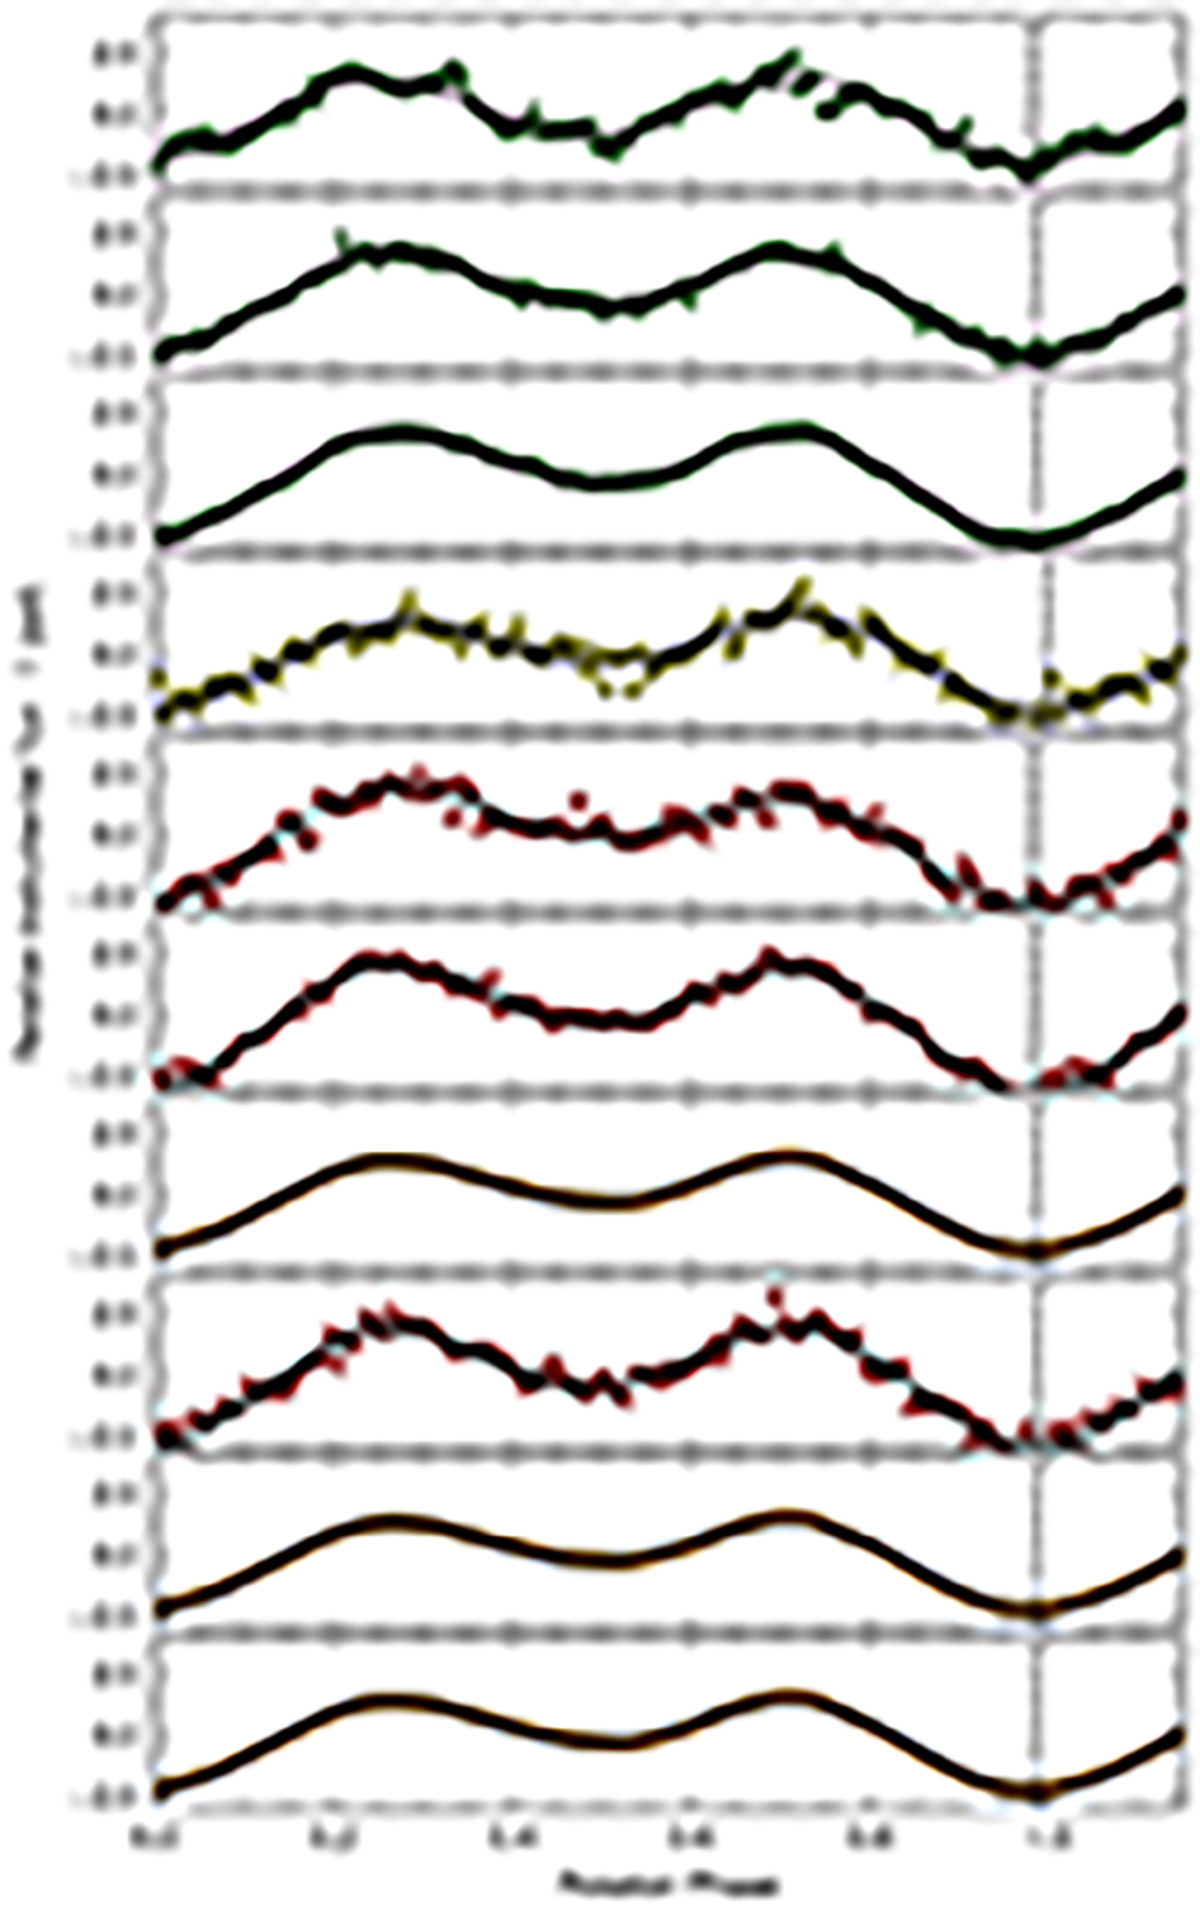
Heavily binned light curves of α Cir folded with the finally adopted rotation period sorted by their observing epoch. Solid lines correspond to fits with Eq. (1) and the vertical dashed lines indicate the measured phase of the light minima. The datasets are sorted by their observing year and correspond from top to bottom to the WIRE 2000, 2005, and 2006 data, SMEI, BRITE 2014 and 2016 data, TESS 2019, BRITE 2021, TESS 2021, and the TESS 2023 data.
Current usage metrics show cumulative count of Article Views (full-text article views including HTML views, PDF and ePub downloads, according to the available data) and Abstracts Views on Vision4Press platform.
Data correspond to usage on the plateform after 2015. The current usage metrics is available 48-96 hours after online publication and is updated daily on week days.
Initial download of the metrics may take a while.