Fig. 7.
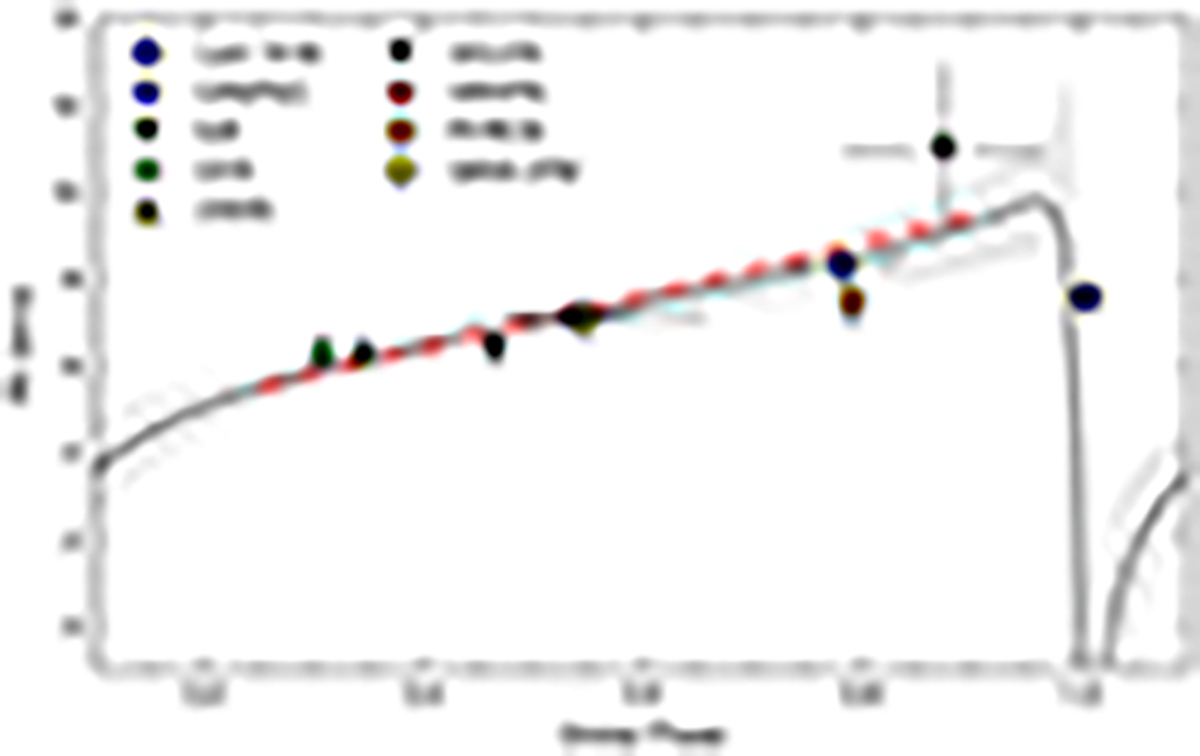
Download original image
Radial velocity measurements as a function of the orbital phase with the fit from Fig. 5 scaled according to Eq. (3) and vertically shifted by 0.23 km s−1. The red dashed-dotted line corresponds to a linear fit to the RV values (except the one from Lunt 1918). The horizontal error bars reflect the time range during which the RV is obtained.
Current usage metrics show cumulative count of Article Views (full-text article views including HTML views, PDF and ePub downloads, according to the available data) and Abstracts Views on Vision4Press platform.
Data correspond to usage on the plateform after 2015. The current usage metrics is available 48-96 hours after online publication and is updated daily on week days.
Initial download of the metrics may take a while.