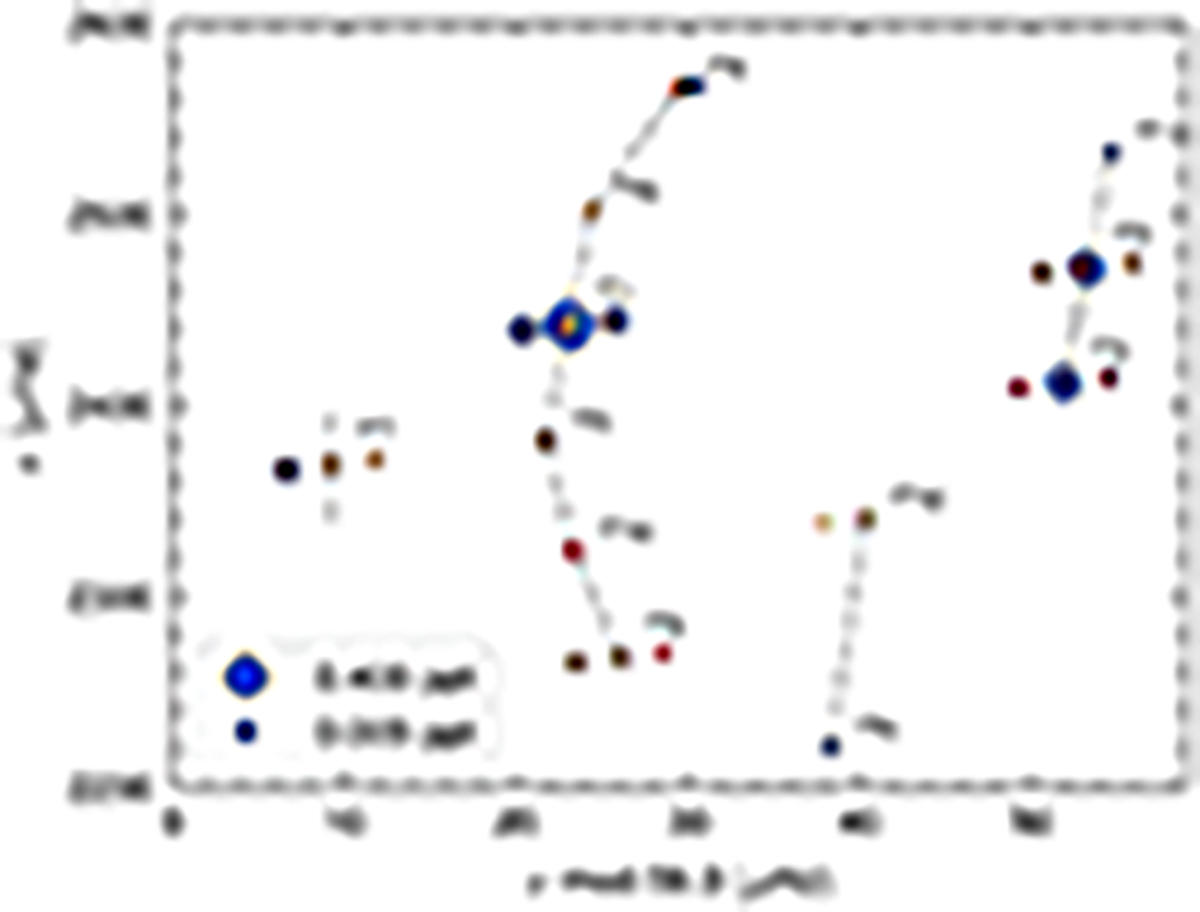
Fig. 4.
Download original image
Echelle diagram of the TESS 2019 frequencies with the (blue) symbol size indicating the mode amplitude and the annotation according to Table 3. Red and green symbols give the corresponding frequencies in the 2021 and 2023 dataset, respectively. Modes of presumably the same spherical degree are connected by dashed line segments.
Current usage metrics show cumulative count of Article Views (full-text article views including HTML views, PDF and ePub downloads, according to the available data) and Abstracts Views on Vision4Press platform.
Data correspond to usage on the plateform after 2015. The current usage metrics is available 48-96 hours after online publication and is updated daily on week days.
Initial download of the metrics may take a while.