Fig. 3.
Download original image
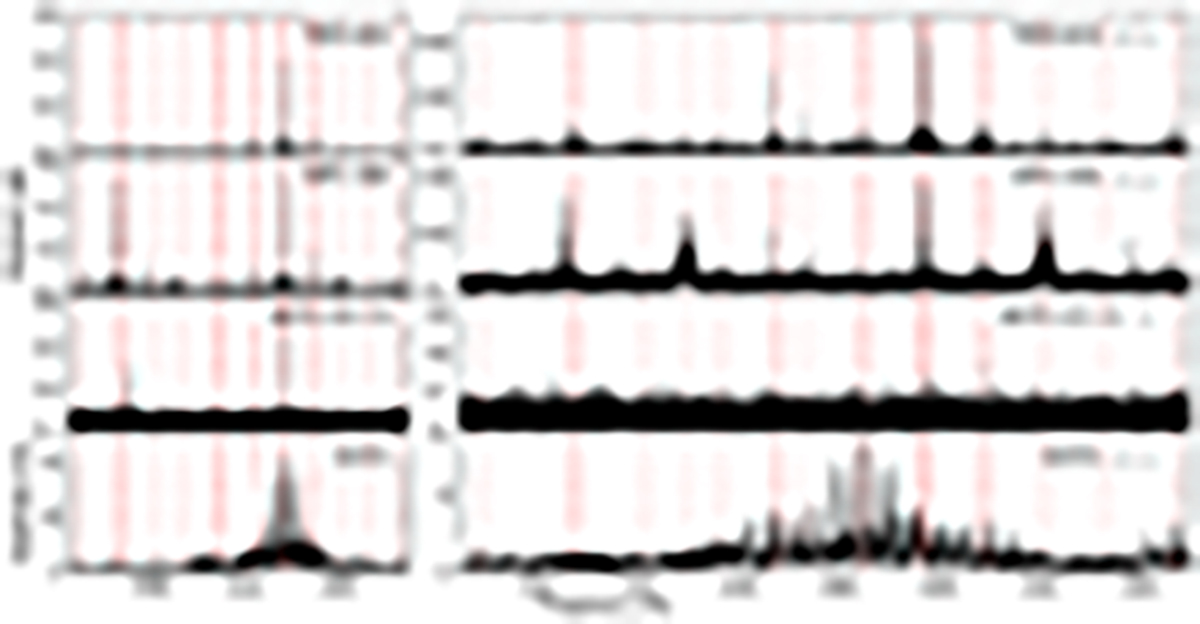
Fourier amplitude spetra of the TESS 2019, WIRE 2006, combined BRITE 2014-16 light curves, and the HARPS radial velocities with the significant TESS frequencies overlaid as vertical red dotted lines. The original spectra are shown in the left panels, whereas right panels give the spectra after prewhitening the one to three most significant frequencies.
Current usage metrics show cumulative count of Article Views (full-text article views including HTML views, PDF and ePub downloads, according to the available data) and Abstracts Views on Vision4Press platform.
Data correspond to usage on the plateform after 2015. The current usage metrics is available 48-96 hours after online publication and is updated daily on week days.
Initial download of the metrics may take a while.