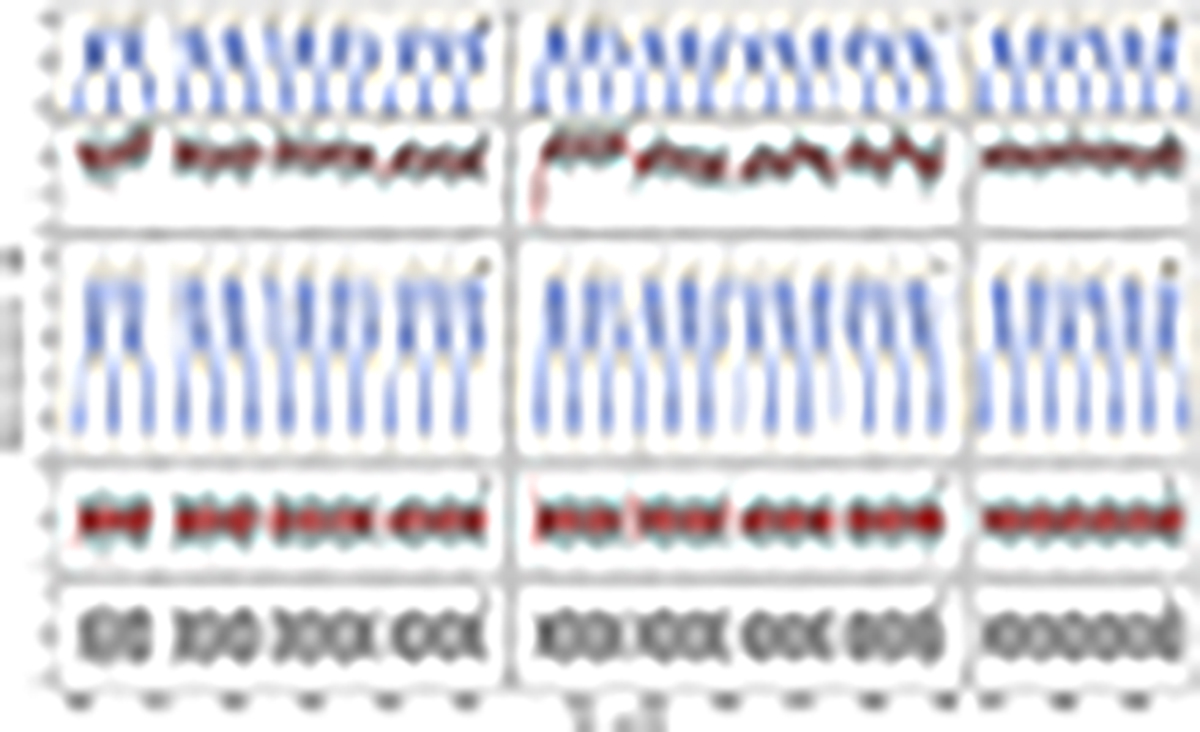
Fig. 2.
Download original image
TESS 2019 (left), 2021 (middle), and 2023 (right) light curves. Panels a: double harmonic fit (blue lines) to the original PDC_SAP data (grey dots). Panels b: original (grey dots) and heavily smoothed (red lines) residuals to the double harmonic fit of panels a. Panels c: original data corrected for the smoothed residuals from panels b (grey dots – these data are used for the rotation analysis) along with a double harmonic fit (blue lines). Panels d: original (grey dots) and heavily smoothed residuals (red lines) from panels c. Panels e: residuals from panels d. These data are used for the pulsation analysis.
Current usage metrics show cumulative count of Article Views (full-text article views including HTML views, PDF and ePub downloads, according to the available data) and Abstracts Views on Vision4Press platform.
Data correspond to usage on the plateform after 2015. The current usage metrics is available 48-96 hours after online publication and is updated daily on week days.
Initial download of the metrics may take a while.