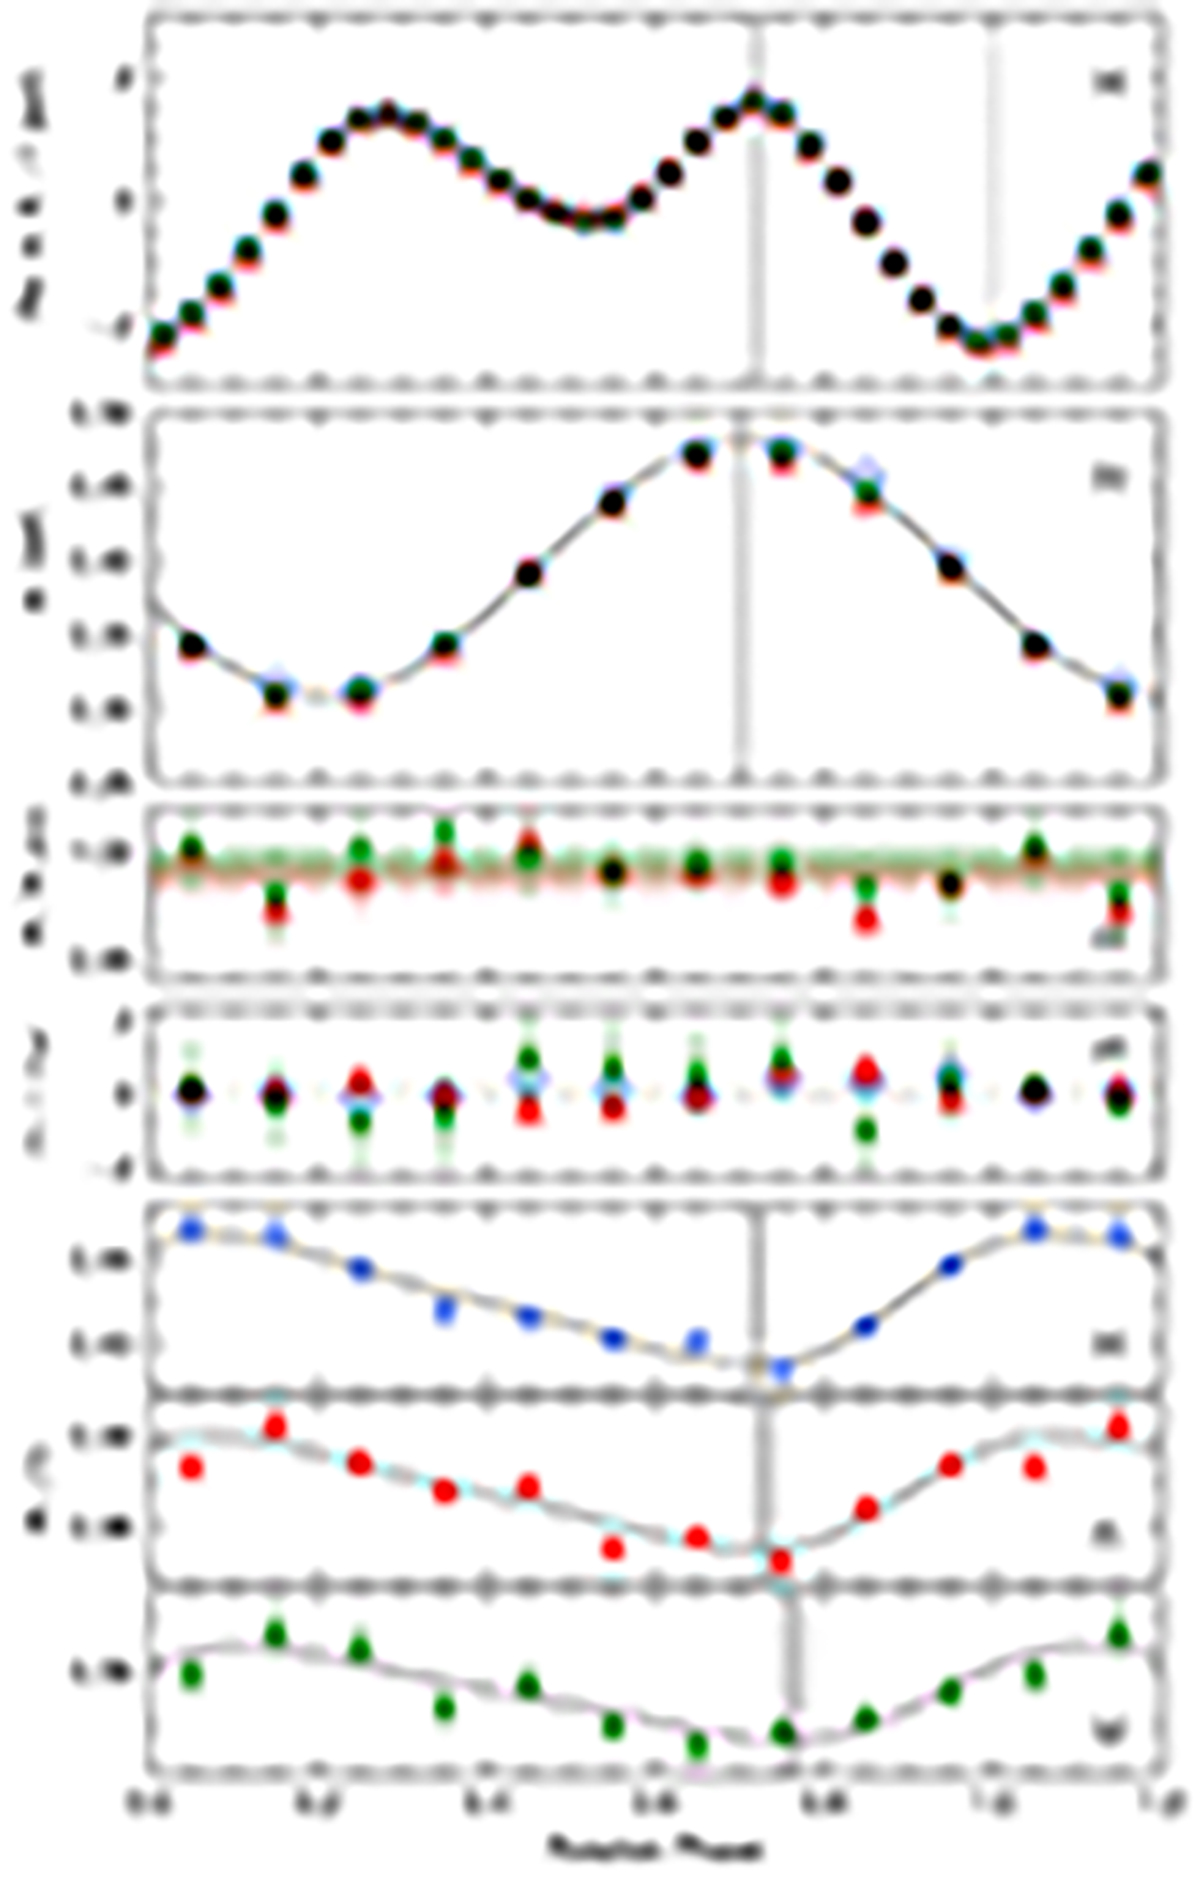
Fig. 10.
Download original image
Amplitude, frequency, and phase of the main pulsation frequency ν1 as a function of the rotation phase (zero point in time t0 = BJD 2 459 500.055) for the TESS 2019 (blue), 2021 (red), and 2023 (green) data. Panel a: heavily binned relative instrumental flux with the vertical dashed and dotted lines indicating the phase of the maximum and minimum light, respectively. Panel b: amplitude of the main pulsation signal (a1) in the various datasets. The black line gives a sinusoidal fit to the 2019 amplitudes with the vertical dashed line indicating the maximum amplitude. Panel c: amplitudes in the 2021 and 2023 data relative to the 2019 amplitudes. Coloured dashed lines and shaded areas give the average ratio and its standard deviation. Panel d: difference (in nHz) of the main pulsation frequency ν1 to the full-length dataset frequency νref (≡ν1 in Tables 3 and 4). Panels e, f, g: phase of the main pulsation signal Φ1. The black lines give the fits to observed values with the vertical dashed lines and grey-shaded areas indicating the minimum phases of the fits and their uncertainties, respectively.
Current usage metrics show cumulative count of Article Views (full-text article views including HTML views, PDF and ePub downloads, according to the available data) and Abstracts Views on Vision4Press platform.
Data correspond to usage on the plateform after 2015. The current usage metrics is available 48-96 hours after online publication and is updated daily on week days.
Initial download of the metrics may take a while.