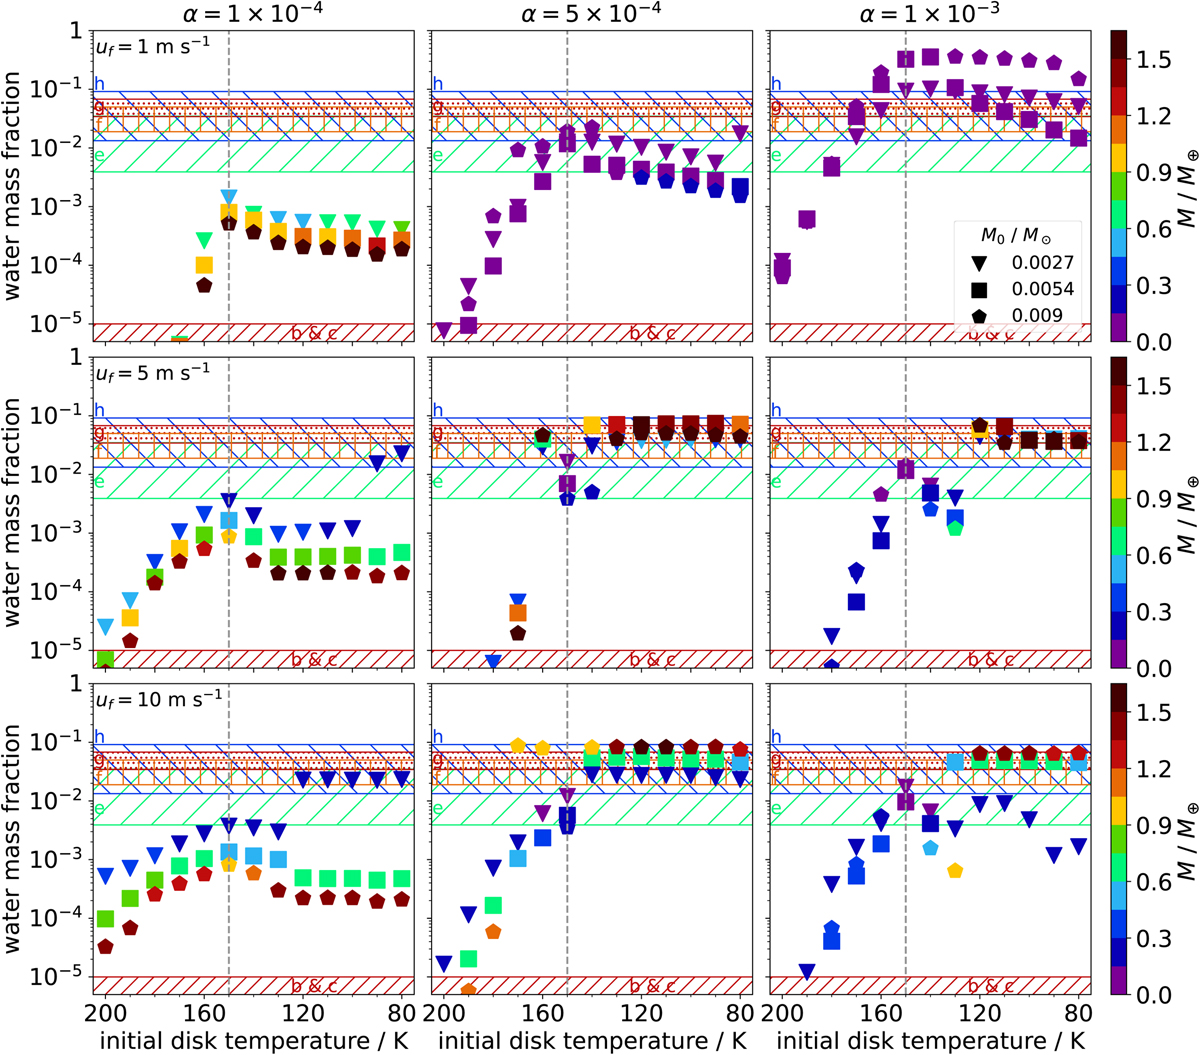
Fig. 5
Download original image
Final planetary water mass fraction versus initial local disk temperature at the position of the planet as a proxy for the distance from the star. Planets that are not shown in the plot have lower water mass fractions than 10−5. The columns correspond to different values of the α-viscosity, the rows show different solid fragmentation velocity values. Each marker corresponds to one planet starting at a specific disk temperature. The color of the markers indicates the final mass of the planet (see color-bars on the right). The shape of the markers specifies the initial mass of the disk in which the planet grows (see legend). The hatched regions in the background correspond to the 1σ-regions of the water mass fractions of the TRAPPIST-1 planets estimated by Raymond et al. (2022) using their model ii and are color-coded according to the observed masses of the TRAPPIST-1 planets using the same color-bar. The vertical lines indicate the location of the water-evaporation front. We use our full model, which consists of both the Brouwers opacity model (vim = 30.0 m s−1, F = 0.0) and the Birnstiel pebble drift, while applying the planetary envelope model described above. In addition, we account for the planetary migration and the evaporation of pebbles in the disk as they drift inwards.
Current usage metrics show cumulative count of Article Views (full-text article views including HTML views, PDF and ePub downloads, according to the available data) and Abstracts Views on Vision4Press platform.
Data correspond to usage on the plateform after 2015. The current usage metrics is available 48-96 hours after online publication and is updated daily on week days.
Initial download of the metrics may take a while.