Fig. 3
Download original image
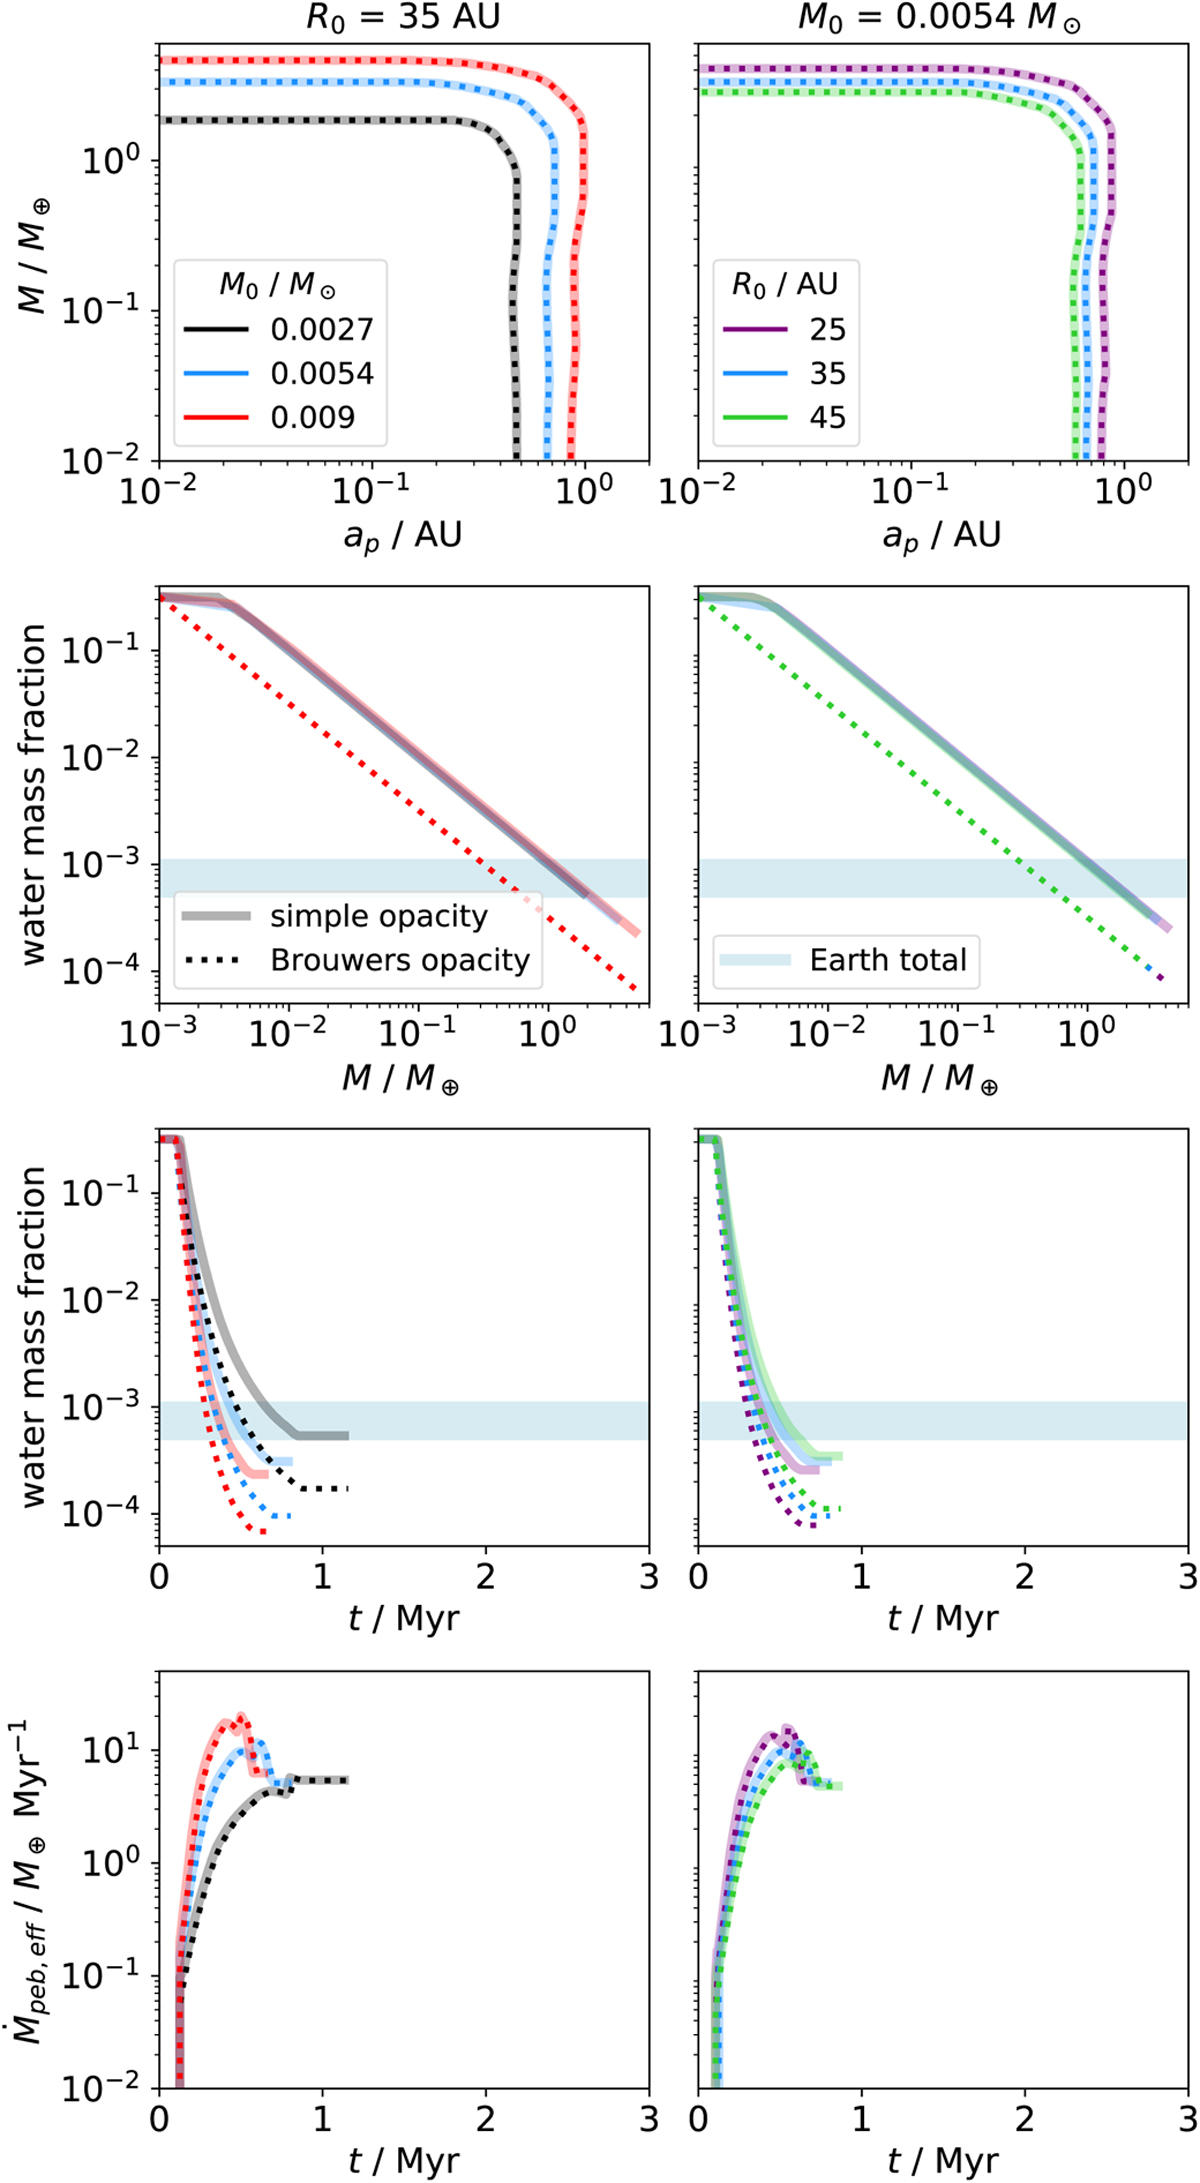
Comparison of planets using the simple envelope opacity model of Johansen et al. (2021) with κenv,0 = 0.1 cm2 g−1 (see Eq. (10); transparent lines) and the Brouwers opacity model by Brouwers et al. (2021) with vlim = 30.0 m s−1 and F = 0.0 (see Eq. (11); dotted lines) for different initial disk masses (left) and different initial disk radii (right). The pebbles in the disk follow the motion of the gas and behave similarly as in Johansen et al. (2021). The planets start at a disk temperature of 100 K and migrate toward the inner edge of the disk within 1.5 Myr, causing the simulation to end. The growth of the planet initiates at t0 = 0.1 Myr. The maximum disk lifetime is set to 5 Myr, but for the sake of clarity we only show the first 3 Myr in the bottom two rows. The light-blue region corresponds to the estimated total water mass fraction of the Earth, consisting of contributions from the hydrosphere, the exosphere including the crust, and the mantle (e.g., Marty 2012; D’Angelo et al. 2019). First row: growth tracks. Due to the viscous heating of the protoplanetary disk, the initial position of the planet changes for different initial disk masses and radii, as we want to keep it in the same relative position exterior to the water-evaporation line. Second row: planetary water mass fraction as a function of planetary mass. Third row: planetary water mass fraction as a function of time. For the sake of clarity, only the first 3 Myr are shown in this and the following row. Last row: effective pebble accretion rates onto the planet as a function of time.
Current usage metrics show cumulative count of Article Views (full-text article views including HTML views, PDF and ePub downloads, according to the available data) and Abstracts Views on Vision4Press platform.
Data correspond to usage on the plateform after 2015. The current usage metrics is available 48-96 hours after online publication and is updated daily on week days.
Initial download of the metrics may take a while.