Fig. 3
Download original image
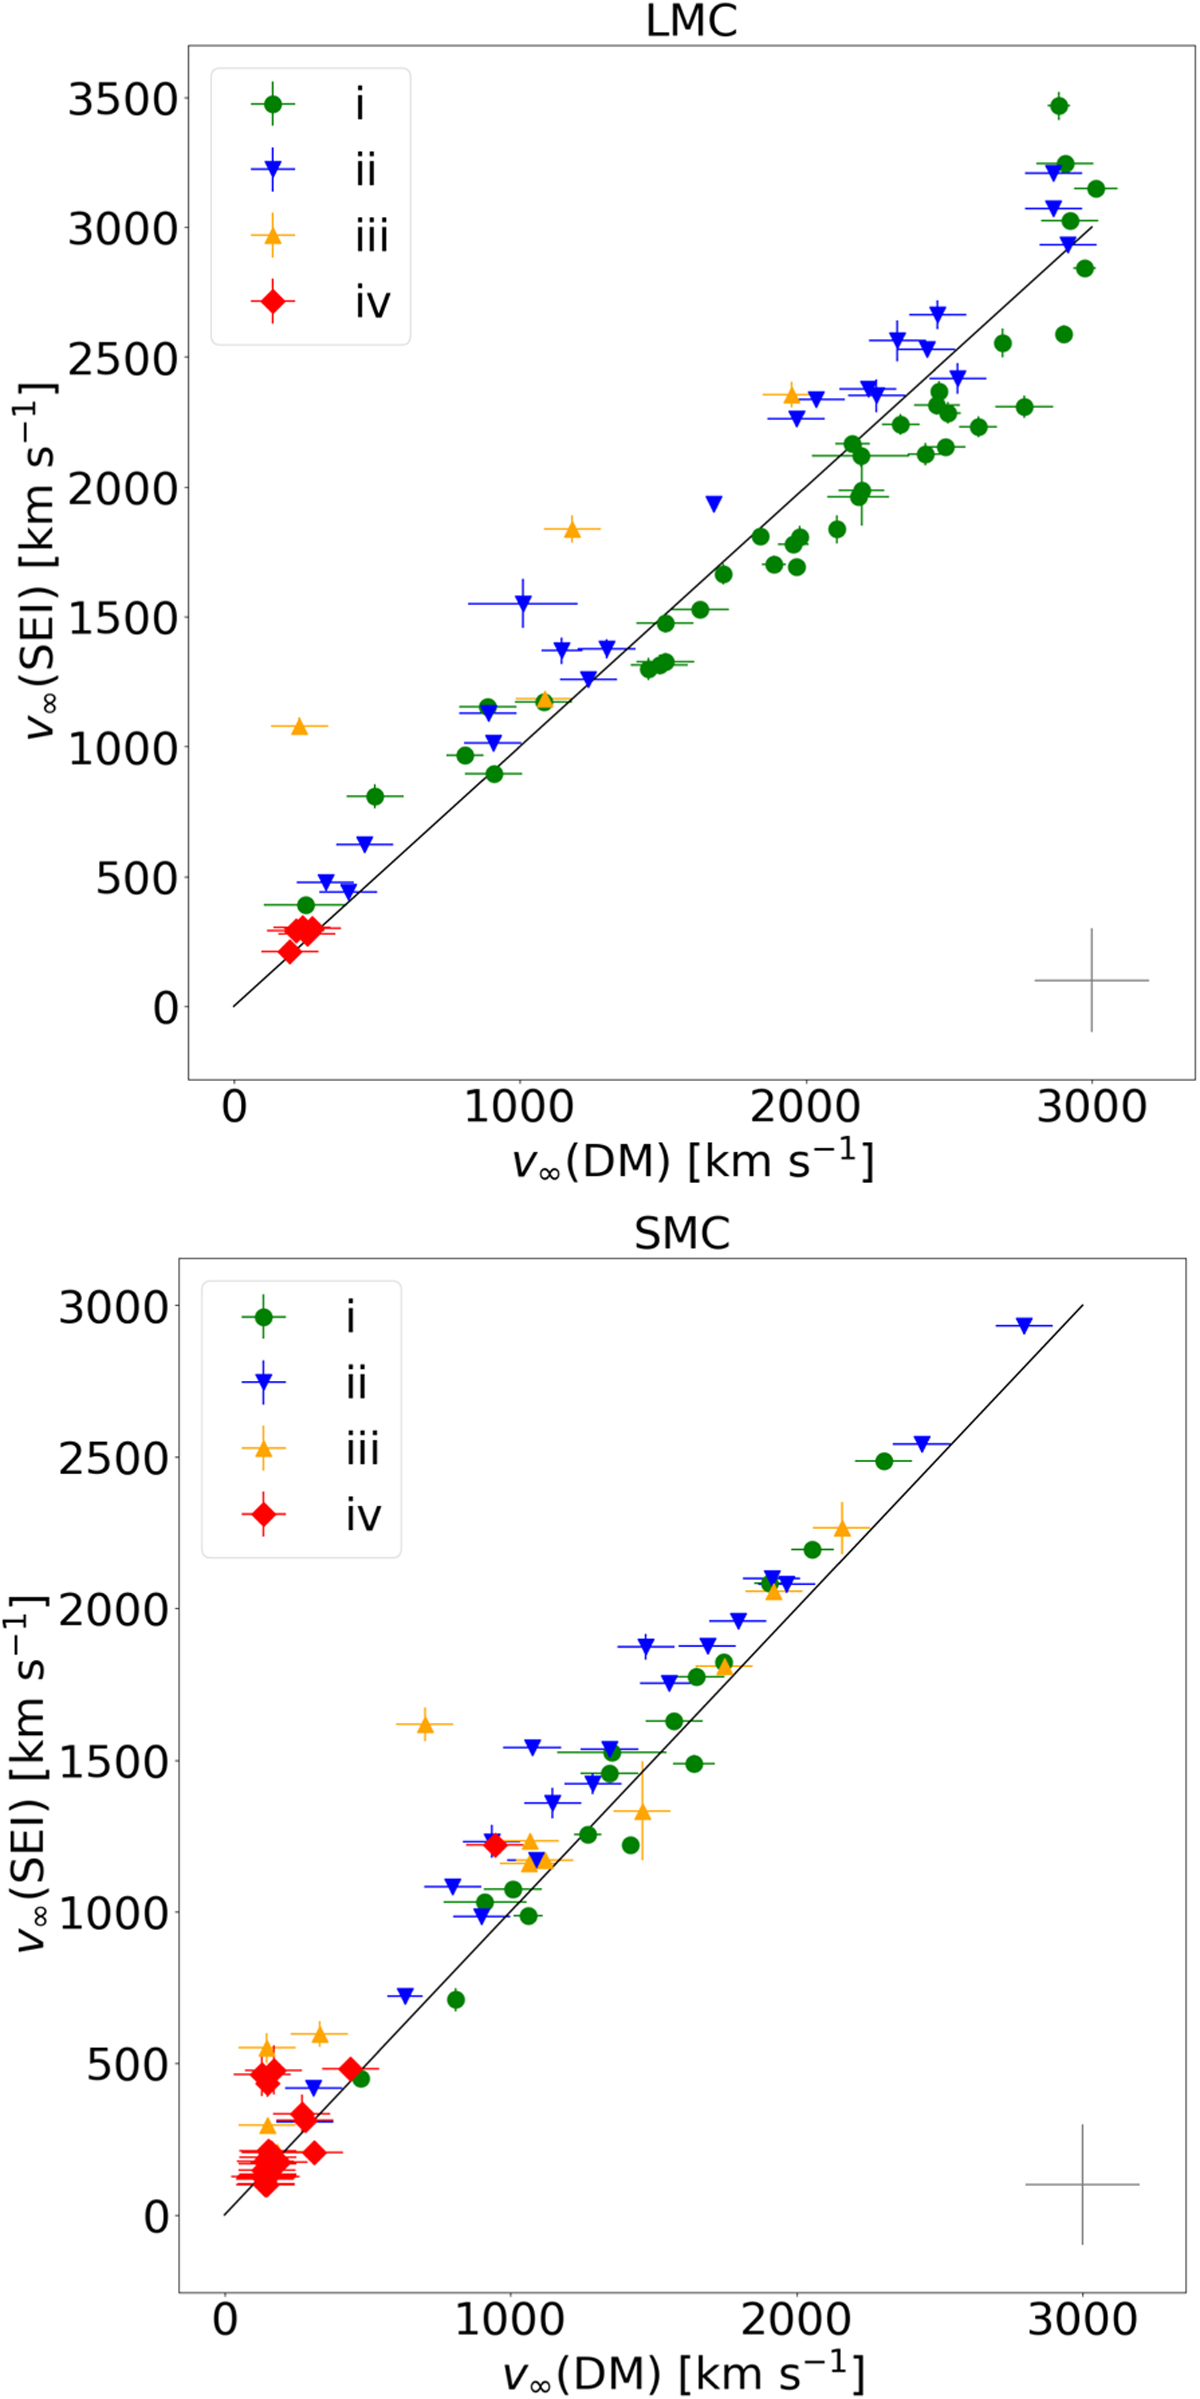
Comparison between terminal wind speed found using direct measurement v∞(DM), against that found using the SEI method v∞ (SEI). Upper panel: LMC sample. Lower panel: SMC sample. Symbol shapes and colours indicate different quality categories from best (i) to worst (iv) (see the legend and Sect. 4). The solid black line is a one-to-one relation between v∞(DM) and v∞(SEI). Conservative uncertainties of 200 km s−1 on each measurement are visualised through the grey cross in the lower right corner of each panel.
Current usage metrics show cumulative count of Article Views (full-text article views including HTML views, PDF and ePub downloads, according to the available data) and Abstracts Views on Vision4Press platform.
Data correspond to usage on the plateform after 2015. The current usage metrics is available 48-96 hours after online publication and is updated daily on week days.
Initial download of the metrics may take a while.