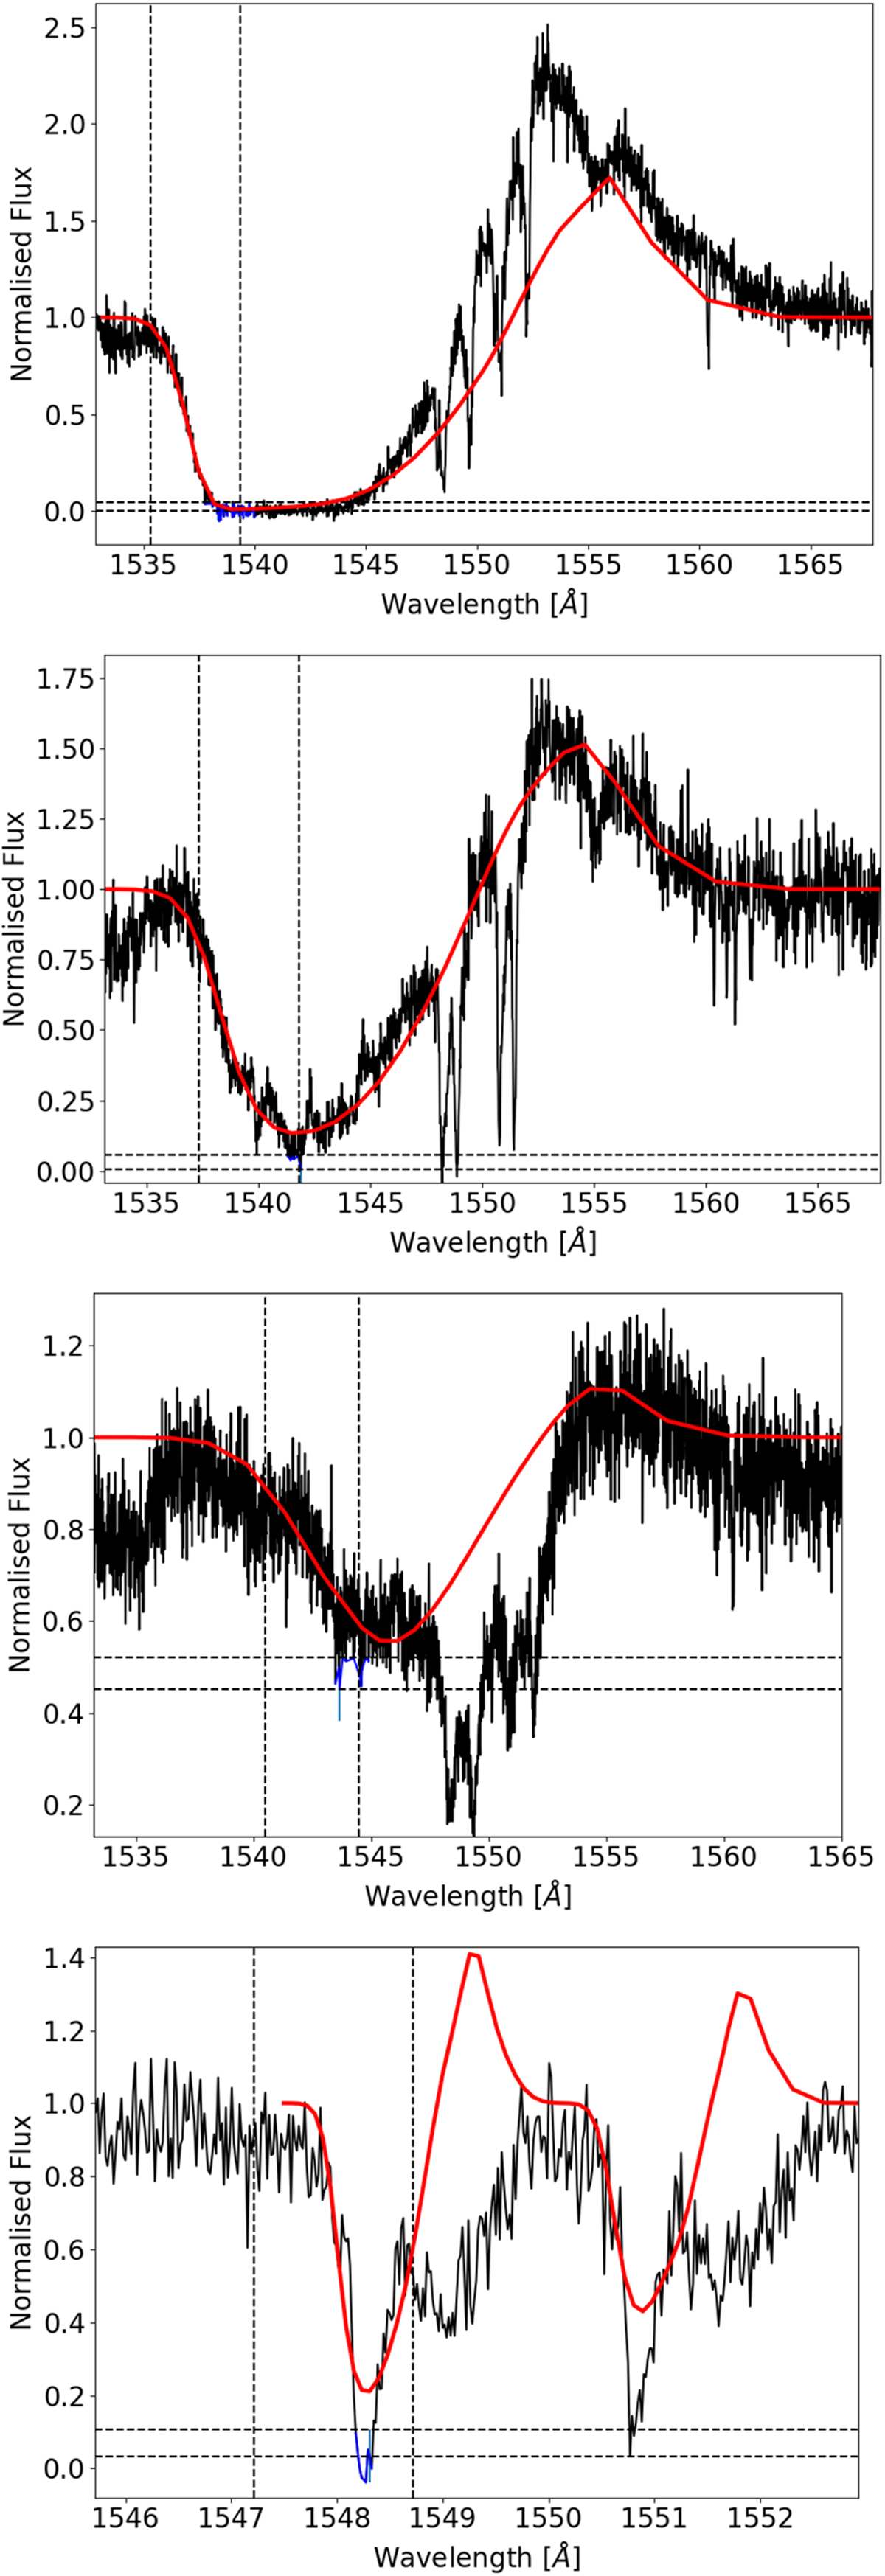
Fig. 2
Download original image
Example of C IV λλ1548–1550 line profiles for different reliability categories from highest (top panel, rank i) to lowest (bottom panel, rank iv). Two profiles shown in this figure are from LMC stars (Sk −65° 47 and Sk −71° 19), and two are from SMC stars (AzV 26 and AzV 216) from the highest to the lowest panel: Sk -65° 47(O4If), AzV 26 (O6If), Sk −71° 19 (O6III), and AzV 216 (B1III). Black lines are the observed spectra. Red lines are the best-fit SEI model. Vertical dashed black lines highlight the fitting region for the SEI model. Horizontal dashed black lines show the S/N limit on the minimum flux of 0. Blue lines are the minimum flux within the S/N.
Current usage metrics show cumulative count of Article Views (full-text article views including HTML views, PDF and ePub downloads, according to the available data) and Abstracts Views on Vision4Press platform.
Data correspond to usage on the plateform after 2015. The current usage metrics is available 48-96 hours after online publication and is updated daily on week days.
Initial download of the metrics may take a while.