Fig. 6.
Download original image
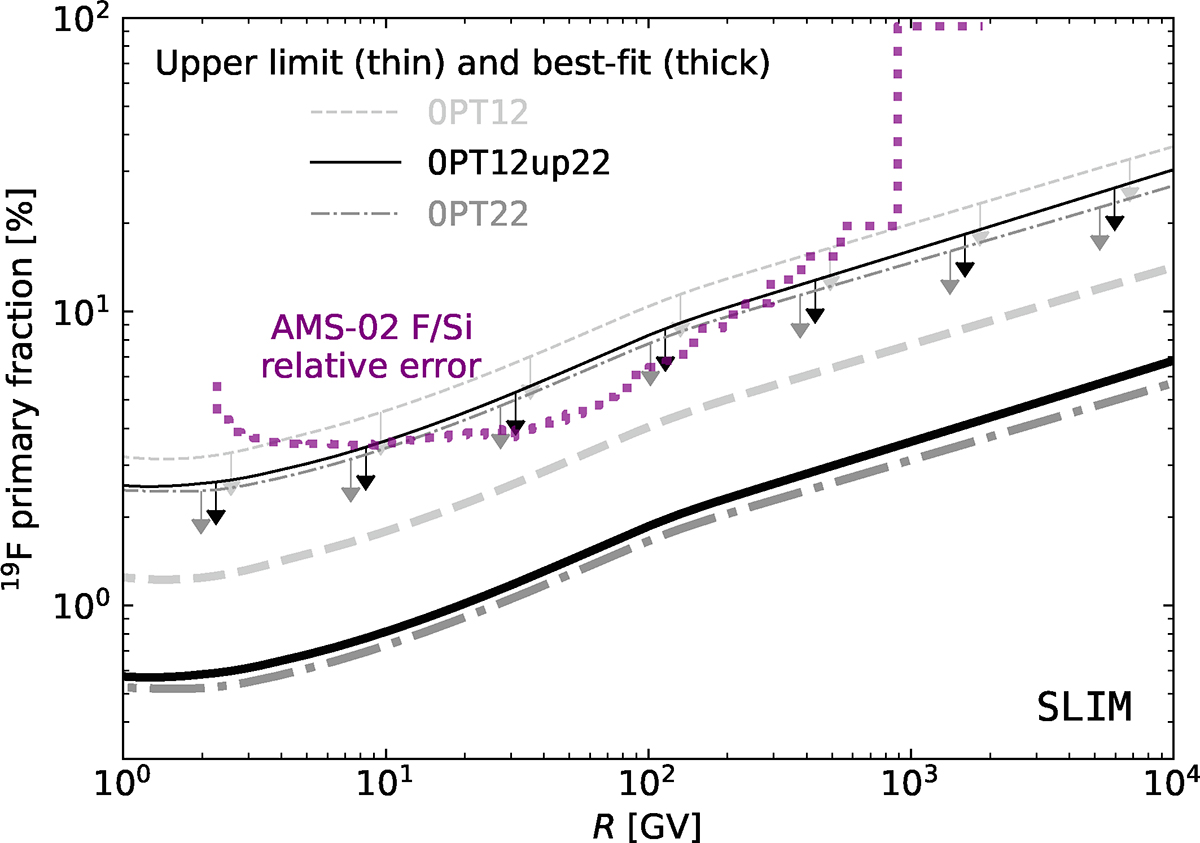
Primary fraction of 19F as a function of rigidity for the propagation configuration SLIM and the three production cross-section sets OPT12 (dashed light-grey lines), OPT12up22 (solid black lines), and OPT22 (dash-dotted grey lines). The thick lines have been calculated from the best-fit source parameter q19F of the combined analysis of F/Si and (Li,Be,B)/C (see filled symbols in Fig. 3). The thin lines with downward arrows show the 1σ upper limits in the same configuration. For comparison, the purple dotted line shows the total relative uncertainties (errors combined quadratically) of the AMS-02 F/Si ratio (see text for discussion).
Current usage metrics show cumulative count of Article Views (full-text article views including HTML views, PDF and ePub downloads, according to the available data) and Abstracts Views on Vision4Press platform.
Data correspond to usage on the plateform after 2015. The current usage metrics is available 48-96 hours after online publication and is updated daily on week days.
Initial download of the metrics may take a while.