Fig. 5.
Download original image
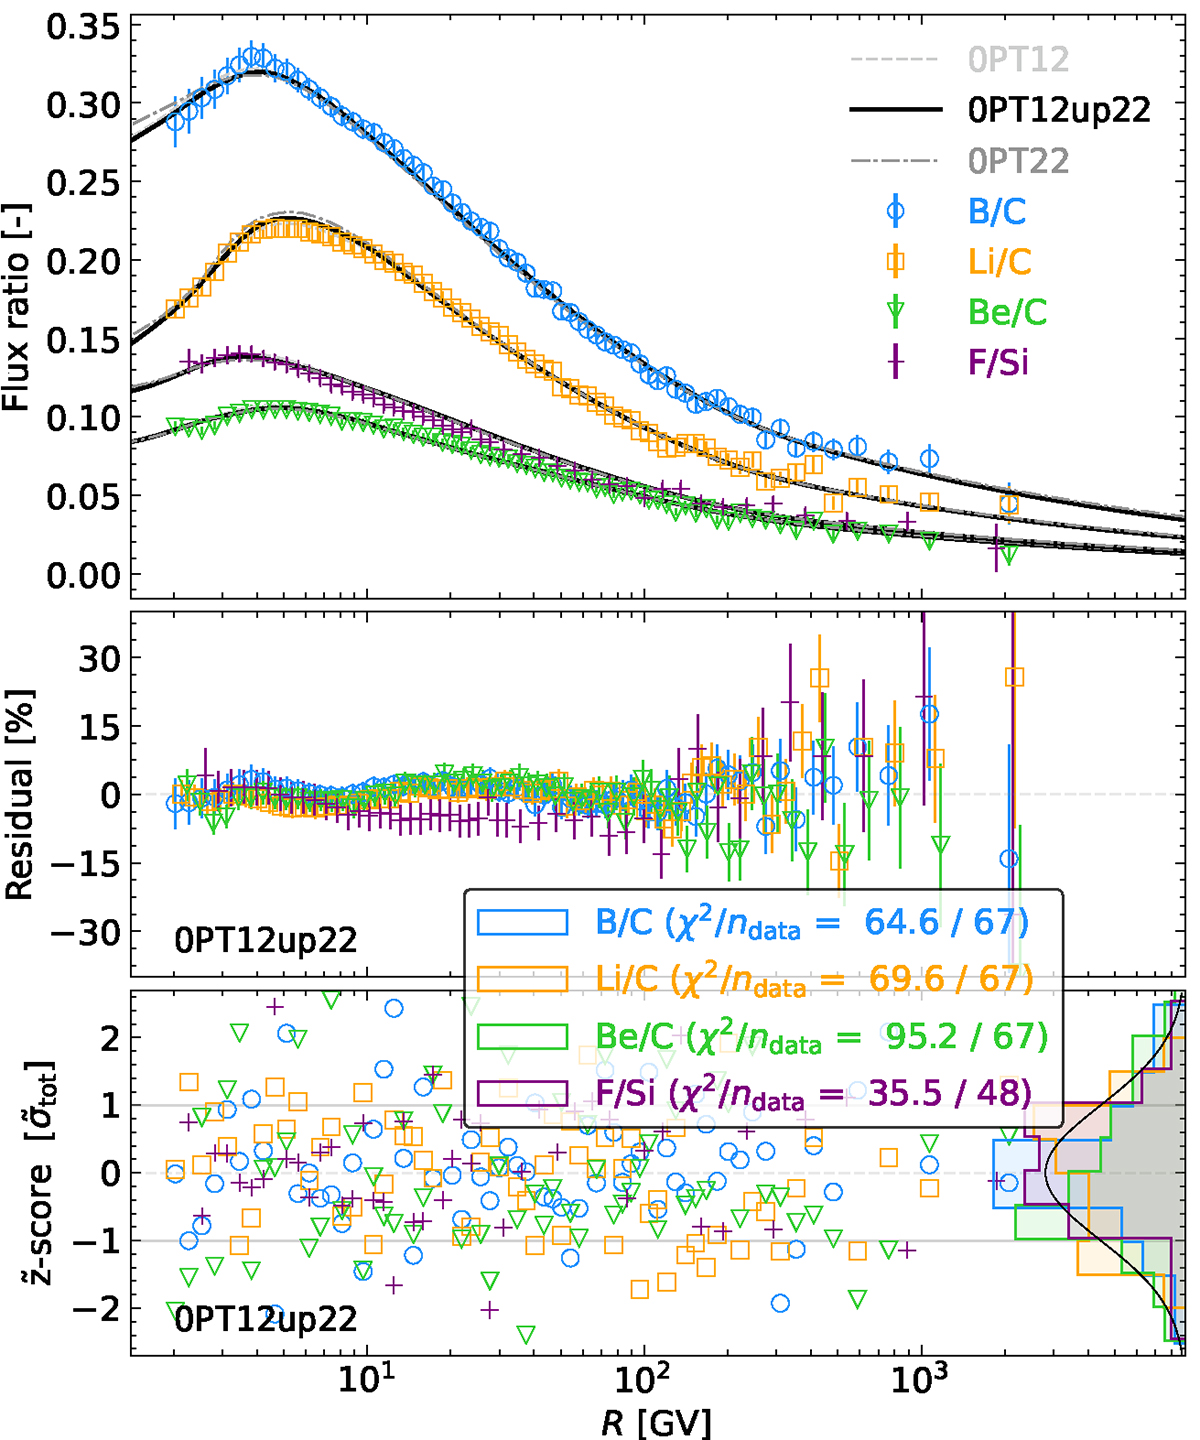
Flux ratios (top), residuals (centre), and ![]() -scores (bottom) for B/C (blue circles), Be/C (green downward triangles), Li/C (orange squares), and fluorine (purple upward triangles). The models (top panel) have been calculated for the updated OPT12 (dashed grey line), OPT12up22 (solid black line), and OPT22 (dashed-dotted grey line) from the best-fit transport parameters of the combined analysis of all three species. In the middle and bottom panels, the residuals and
-scores (bottom) for B/C (blue circles), Be/C (green downward triangles), Li/C (orange squares), and fluorine (purple upward triangles). The models (top panel) have been calculated for the updated OPT12 (dashed grey line), OPT12up22 (solid black line), and OPT22 (dashed-dotted grey line) from the best-fit transport parameters of the combined analysis of all three species. In the middle and bottom panels, the residuals and ![]() -score are shown for the OPT12up22 configuration only. The distributions in the right-hand side of the bottom panel are histograms of the
-score are shown for the OPT12up22 configuration only. The distributions in the right-hand side of the bottom panel are histograms of the ![]() -score values (projected on the y-axis) compared to a 1σ Gaussian distribution (solid black line) (see text for discussion).
-score values (projected on the y-axis) compared to a 1σ Gaussian distribution (solid black line) (see text for discussion).
Current usage metrics show cumulative count of Article Views (full-text article views including HTML views, PDF and ePub downloads, according to the available data) and Abstracts Views on Vision4Press platform.
Data correspond to usage on the plateform after 2015. The current usage metrics is available 48-96 hours after online publication and is updated daily on week days.
Initial download of the metrics may take a while.