Fig. 4.
Download original image
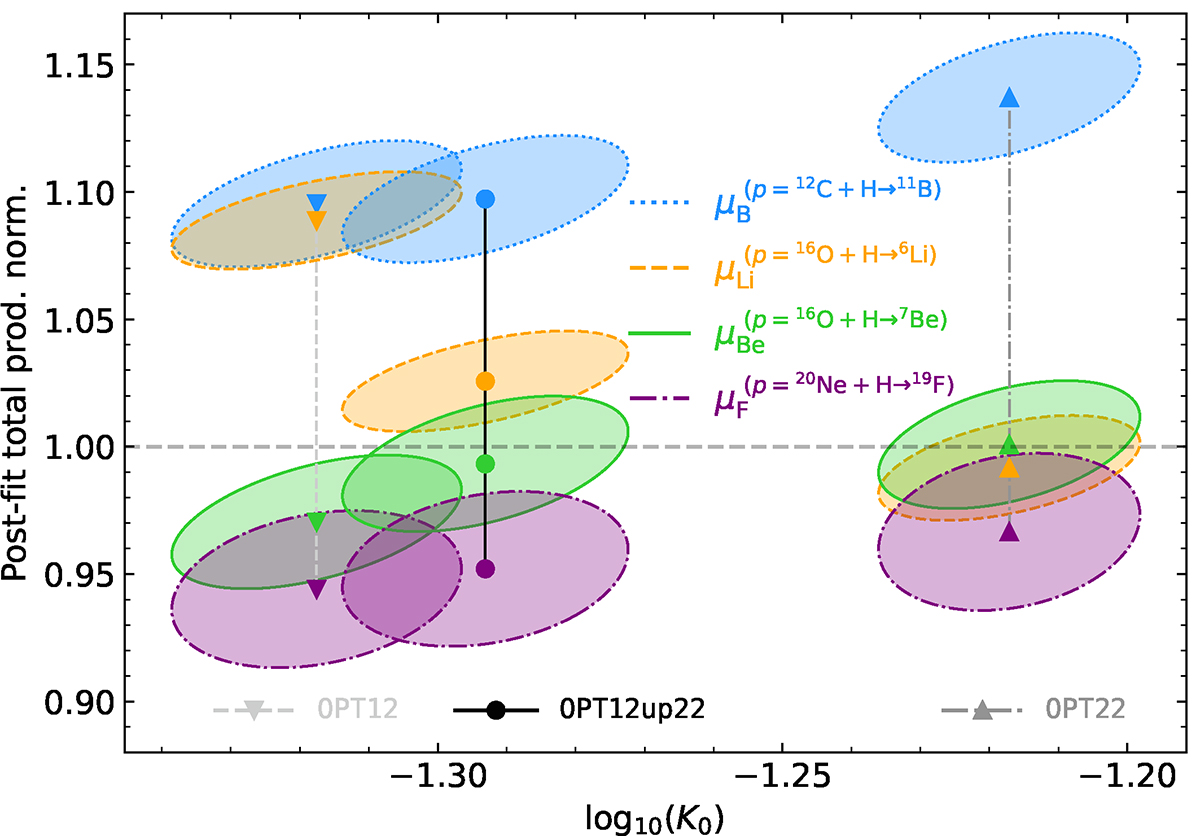
Correlation between log10(K0) and the normalisation factor ![]() , which corresponds to the correction factor applied on the total production cross section (of element Z) in order to best fit AMS-02 F/Si+(Li,Be,B)/C data. The four elements considered are colour-coded: Z = 3 (Li) in orange, Z = 4 (Be) in green, Z = 5 (B) in blue, and Z = 9 (F) in purple. The 1σ correlation ellipses are shown for analyses with different cross-section sets (in model SLIM), from left to right: OPT12 (filled downward triangles), OPT12up22 (filled circles), and OPT22 (filled upward triangles). The horizontal grey dashed line highlights μZ = 1 (i.e. no modification needed for the production of an element).
, which corresponds to the correction factor applied on the total production cross section (of element Z) in order to best fit AMS-02 F/Si+(Li,Be,B)/C data. The four elements considered are colour-coded: Z = 3 (Li) in orange, Z = 4 (Be) in green, Z = 5 (B) in blue, and Z = 9 (F) in purple. The 1σ correlation ellipses are shown for analyses with different cross-section sets (in model SLIM), from left to right: OPT12 (filled downward triangles), OPT12up22 (filled circles), and OPT22 (filled upward triangles). The horizontal grey dashed line highlights μZ = 1 (i.e. no modification needed for the production of an element).
Current usage metrics show cumulative count of Article Views (full-text article views including HTML views, PDF and ePub downloads, according to the available data) and Abstracts Views on Vision4Press platform.
Data correspond to usage on the plateform after 2015. The current usage metrics is available 48-96 hours after online publication and is updated daily on week days.
Initial download of the metrics may take a while.