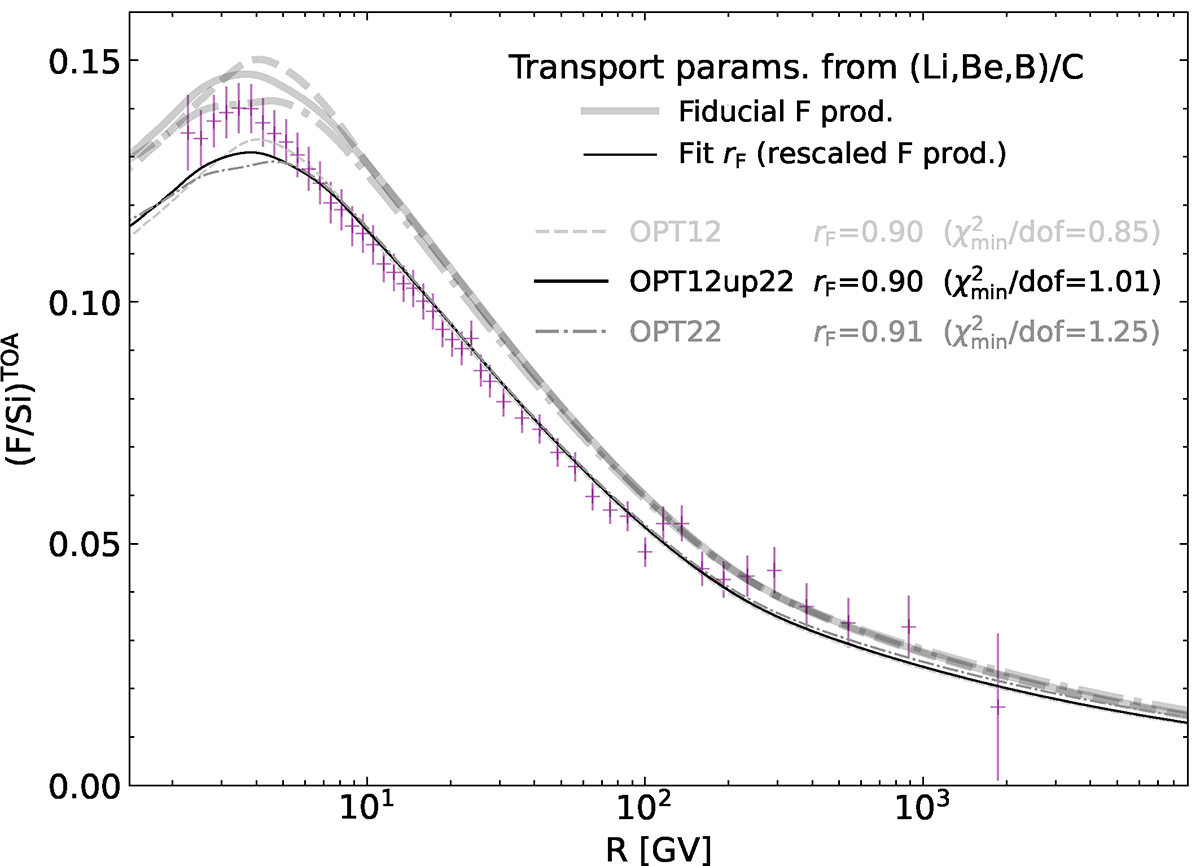
Fig. 2.
Download original image
Comparison of F/Si data (Aguilar et al. 2021d) with calculations (SLIM propagation configuration) calibrated on the (Li,Be,B)/C transport parameters (see Table 2). The thick grey lines show the direct calculation based on our three production cross-section sets (dashed line for OPT12, solid line for OPT12up22, and dotted line for OPT22). The thin lines result from the additional fit of a global factor rF (rescaling the overall production of F) to better match the data. A pure secondary origin of fluorine was assumed in both calculations (see text for discussion).
Current usage metrics show cumulative count of Article Views (full-text article views including HTML views, PDF and ePub downloads, according to the available data) and Abstracts Views on Vision4Press platform.
Data correspond to usage on the plateform after 2015. The current usage metrics is available 48-96 hours after online publication and is updated daily on week days.
Initial download of the metrics may take a while.