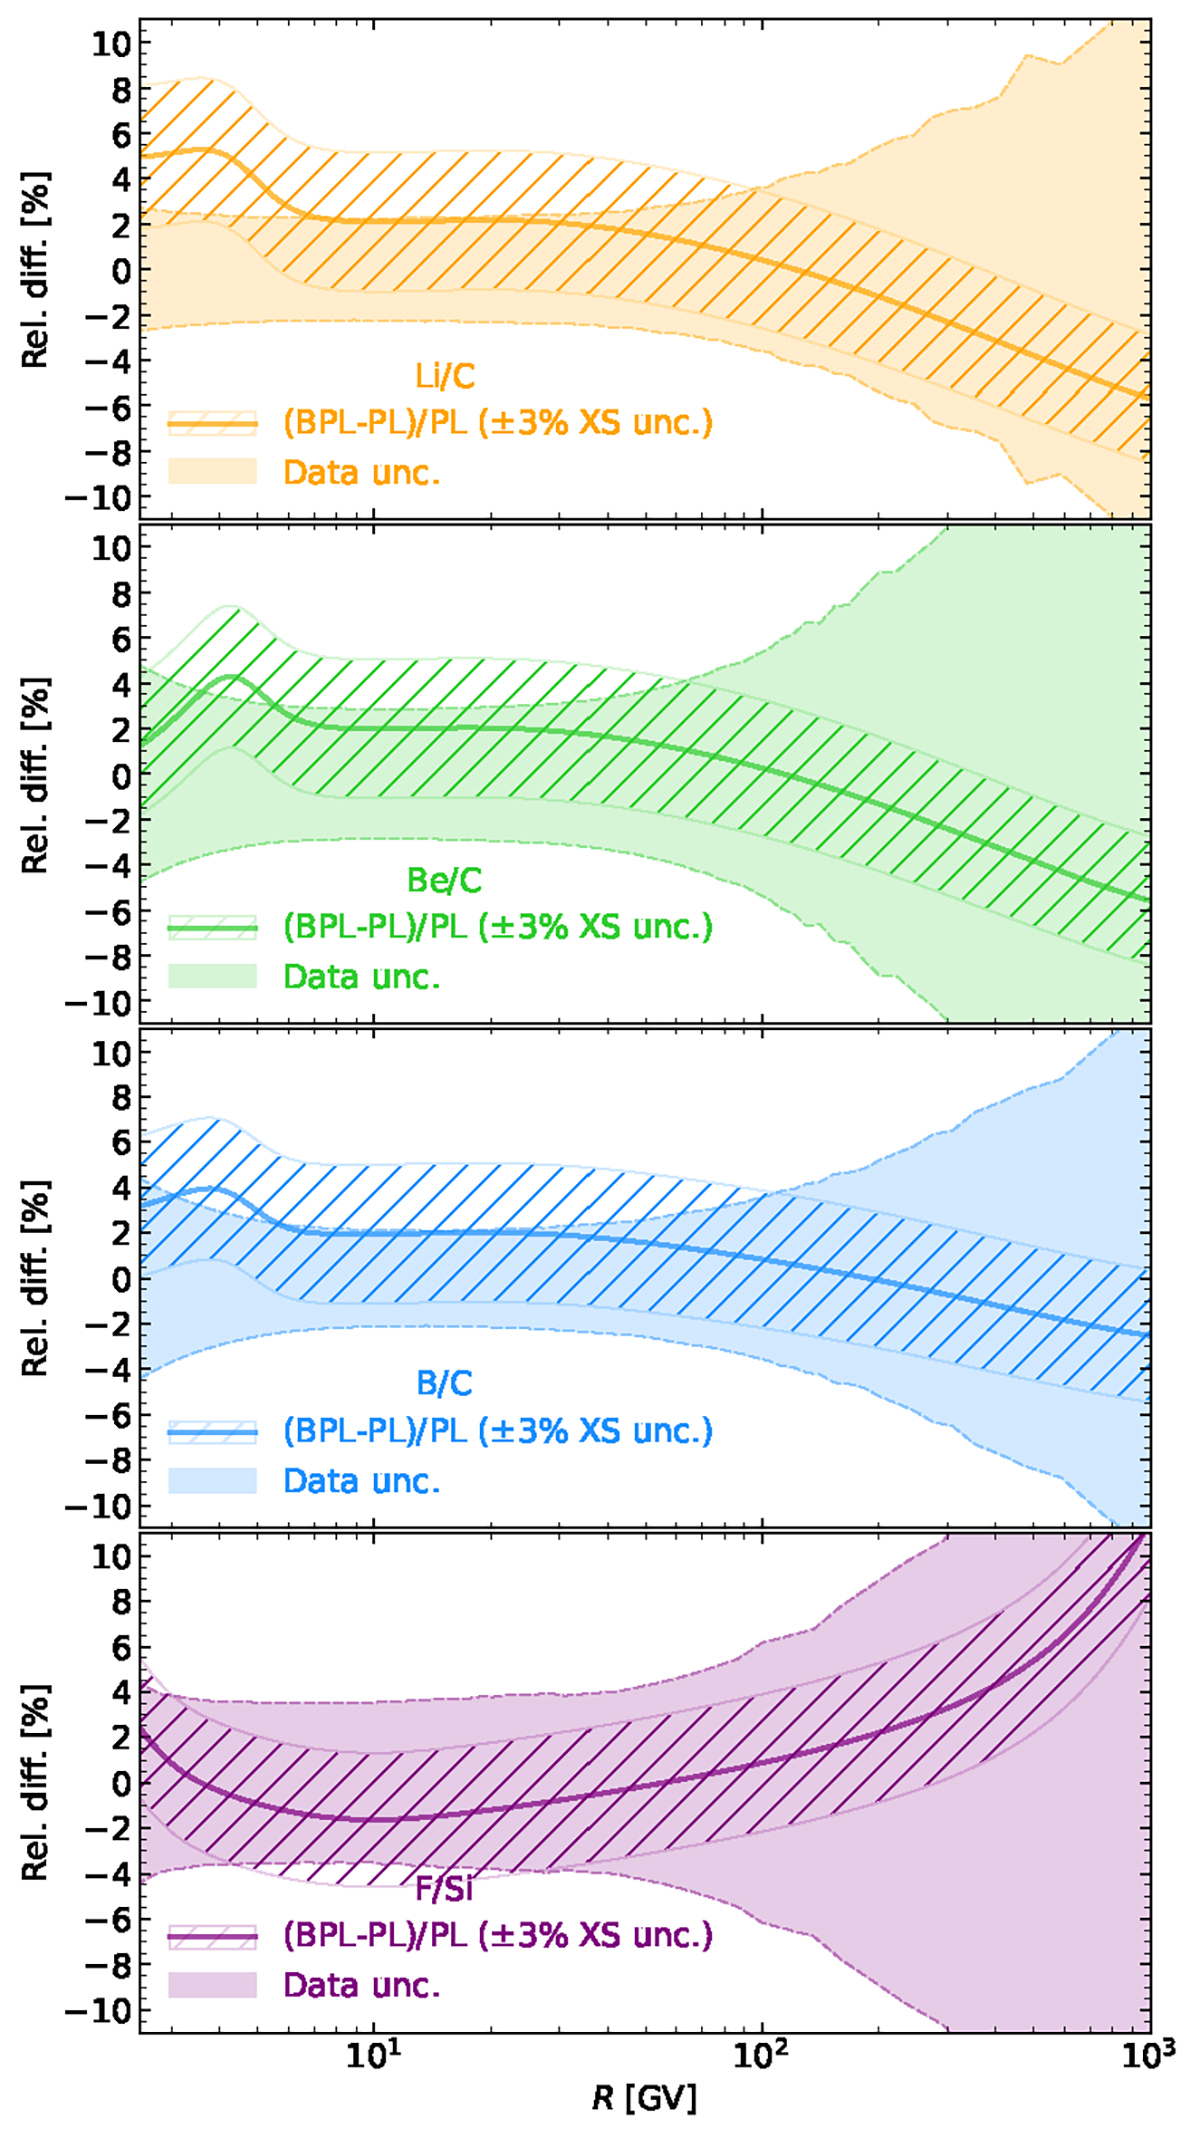
Fig. C.3.
Download original image
Relative difference between secondary-to-primary ratios calculated from the BPL and PL primary spectra, in solid lines. From top to bottom, the four panels show Li/C, Be/C, B/C, and F/Si. The hatched area shows a 3% shift related change in the production cross sections of the secondary in the numerator of these ratios. The shaded band shows the AMS-02 data relative uncertainties (systematic and statistical uncertainties added in quadrature). We see that both areas overlap, showing that the difference between assuming PL or BPL does not impact our conclusions. We give more details in the discussion in the expanded text in App. A1.
Current usage metrics show cumulative count of Article Views (full-text article views including HTML views, PDF and ePub downloads, according to the available data) and Abstracts Views on Vision4Press platform.
Data correspond to usage on the plateform after 2015. The current usage metrics is available 48-96 hours after online publication and is updated daily on week days.
Initial download of the metrics may take a while.