Fig. C.1.
Download original image
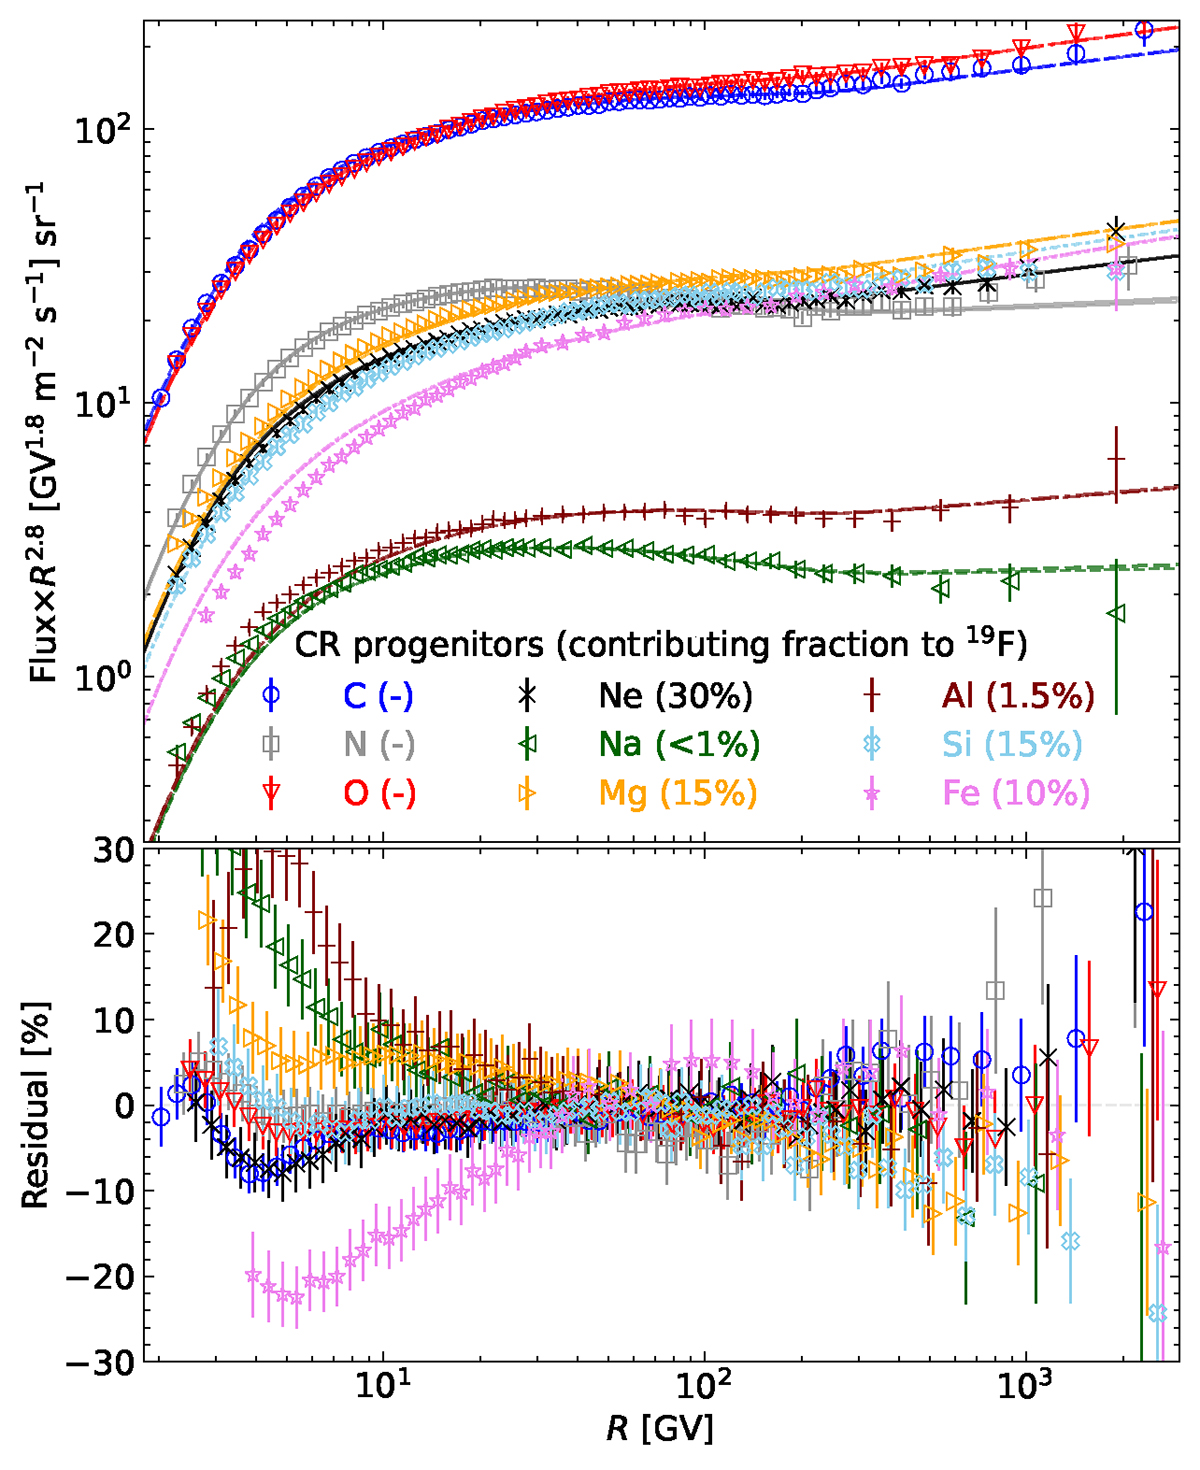
Comparison (top panel) and residuals (bottom panel) of the model calculation (lines) and the AMS-02 data (Aguilar et al. 2017, 2020, 2021b,c) for the main progenitors of Li, Be, B, and F. We recall that this is not a fit to the data (see text). The numbers in parentheses in the legend indicate the fractional contribution of these progenitors to the F production (as read from the top panel of Fig. B.3).
Current usage metrics show cumulative count of Article Views (full-text article views including HTML views, PDF and ePub downloads, according to the available data) and Abstracts Views on Vision4Press platform.
Data correspond to usage on the plateform after 2015. The current usage metrics is available 48-96 hours after online publication and is updated daily on week days.
Initial download of the metrics may take a while.