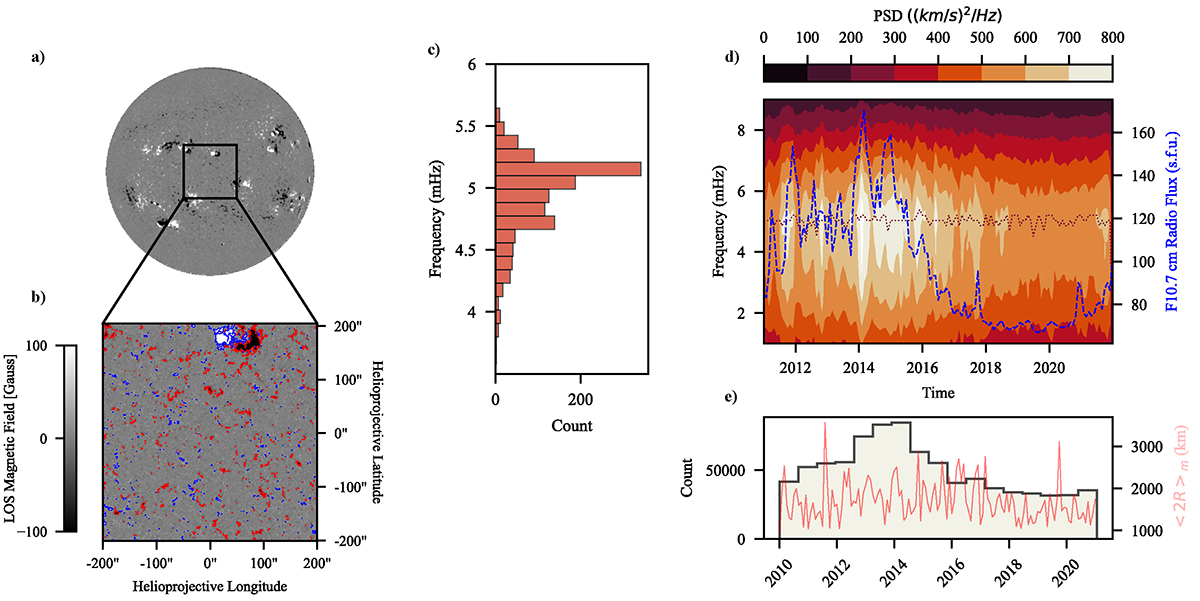
Fig. 1.
Download original image
Analysis of the horizontal velocity oscillations of the magnetic structures considered. (a) Sample full-disk magnetogram obtained by SDO/HMI. (b) Field of view considered in this analysis. Both magnetograms are saturated between −100 G and 100 G. The boundaries of elements detected by the feature-tracking algorithm for positive and negative polarities are contoured using blue and red lines, respectively. (c) Statistical distribution of the dominant frequency within each observational window. The displayed frequency range is constrained between 3.5 and 6.5 mHz. No significant values are observed outside this range. (d) Results of the time-frequency analysis of the elements’ horizontal velocities (vh). The dotted brown line highlights the dominant frequency during each month. The blue line represents the observed radio flux, a common physical proxy used to track the solar activity cycle. (e) Statistical distribution of the number of magnetic structures detected and tracked during the solar activity cycle. The red line represents the average equivalent diameter of the observed magnetic concentrations during each month (⟨2R⟩m).
Current usage metrics show cumulative count of Article Views (full-text article views including HTML views, PDF and ePub downloads, according to the available data) and Abstracts Views on Vision4Press platform.
Data correspond to usage on the plateform after 2015. The current usage metrics is available 48-96 hours after online publication and is updated daily on week days.
Initial download of the metrics may take a while.