Fig. 12.
Download original image
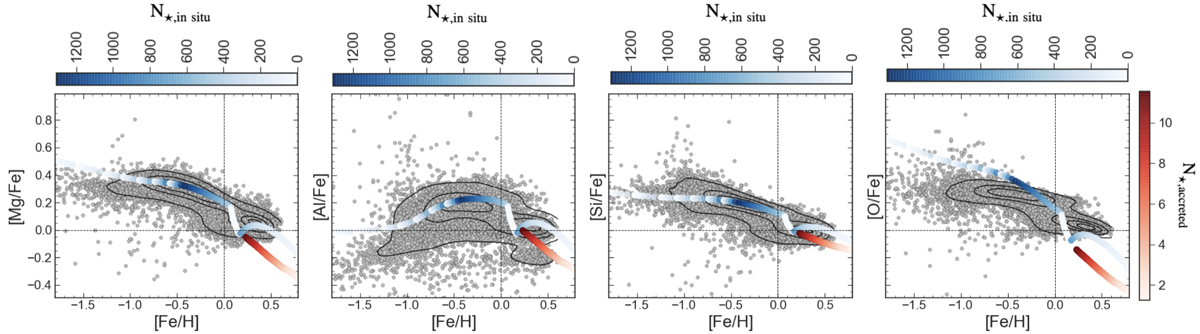
[α/Fe] versus [Fe/H] abundance patterns for Mg, Al, Si, and O as predicted by model 4 (upper blue lines) responsible for the creation of the in situ stellar population and by stars from the inner disk (lower red lines) responsible for the creation of the accreted stellar population in the bulge. Lines are color-coded by the number of stars formed by the model, with the upper blue colorbar referring to the in situ population and the right red colorbar referring to the accreted population.
Current usage metrics show cumulative count of Article Views (full-text article views including HTML views, PDF and ePub downloads, according to the available data) and Abstracts Views on Vision4Press platform.
Data correspond to usage on the plateform after 2015. The current usage metrics is available 48-96 hours after online publication and is updated daily on week days.
Initial download of the metrics may take a while.