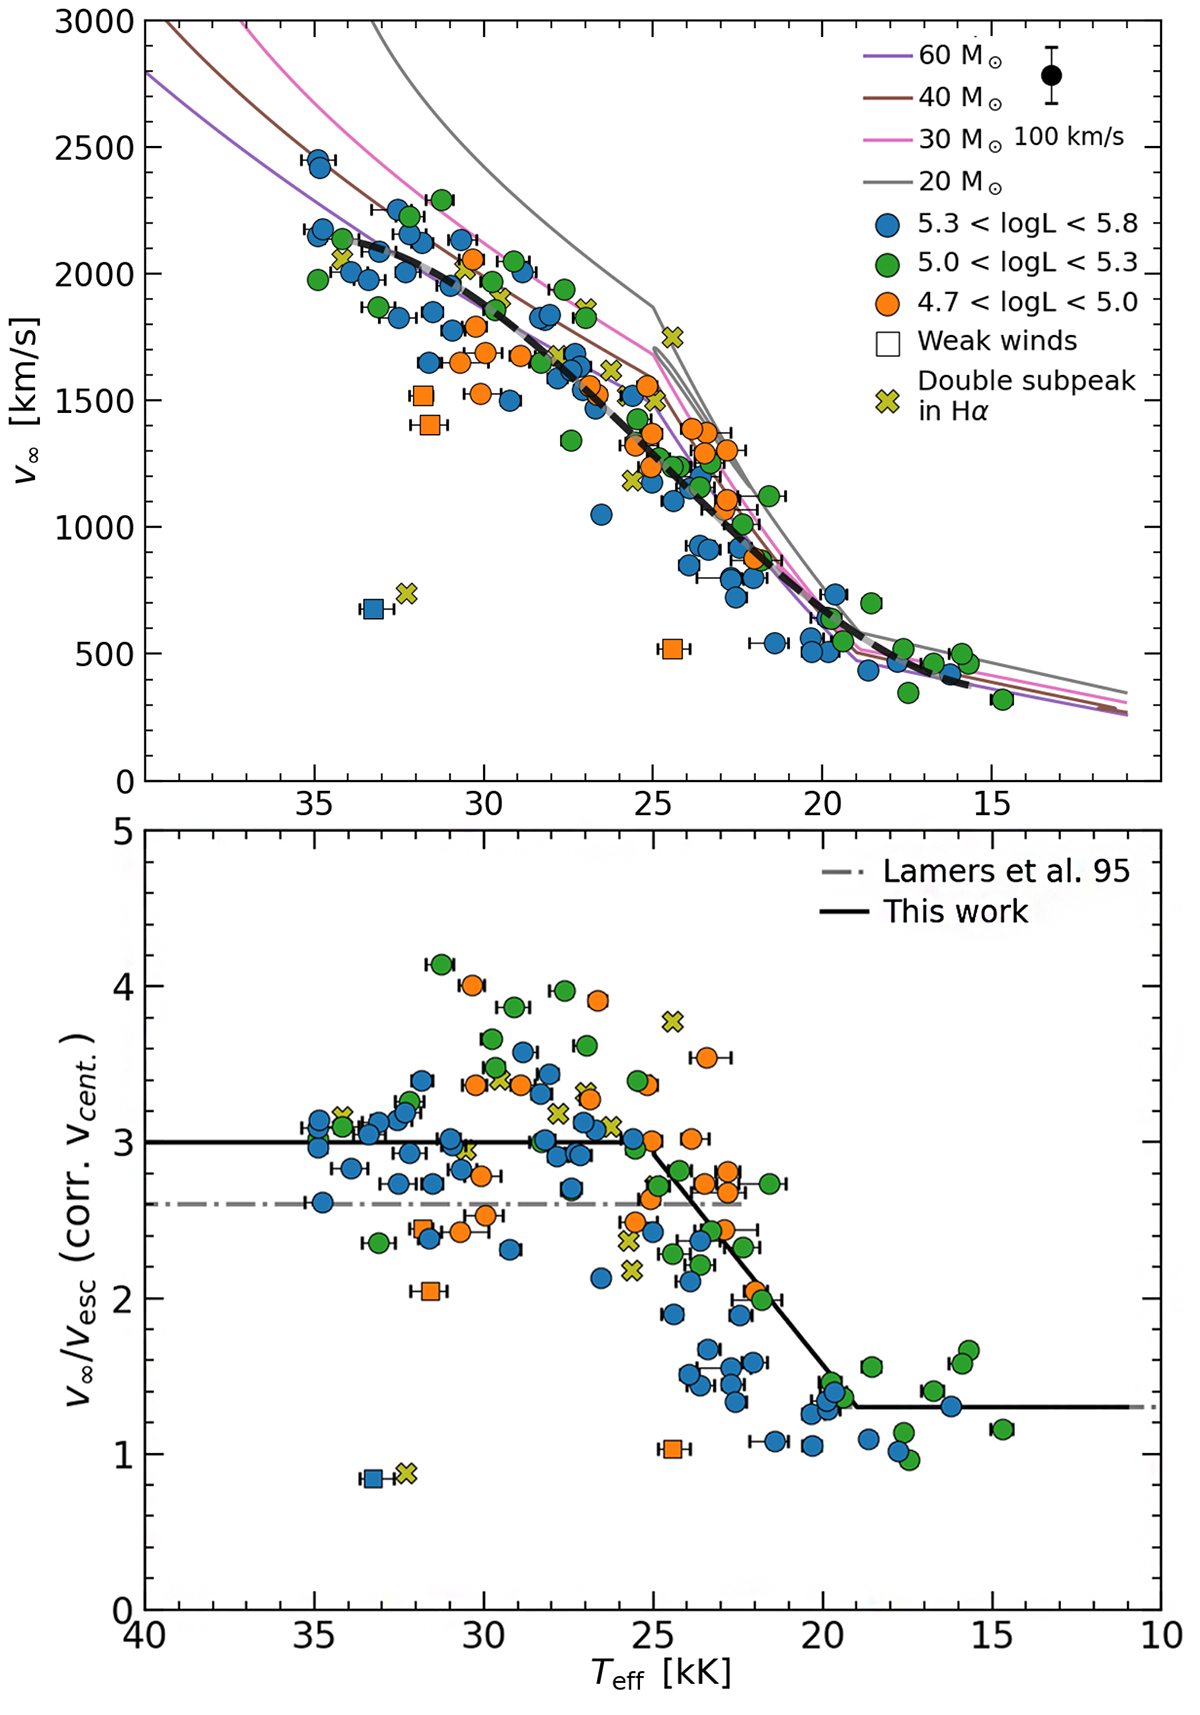
Fig. E.1.
Download original image
Stars in the sample colored by different derived quantities against their effective temperature. Top panel: Adopted values of wind terminal velocities from the literature, whereas the bottom panel shows v∞/vesc, where estimates of vesc have been corrected from centrifugal forces. The tracks and symbols are the same as in Fig.1. The average uncertainty in v∞ is indicated as an error-bar within the legend. The black solid line corresponds to a third order regression of those stars shown with filled circles. In the bottom panel, the solid line indicates our adopted prescription for v∞/vesc, whereas the dashed-dotted line indicates the prescription by Lamers et al. (1995).
Current usage metrics show cumulative count of Article Views (full-text article views including HTML views, PDF and ePub downloads, according to the available data) and Abstracts Views on Vision4Press platform.
Data correspond to usage on the plateform after 2015. The current usage metrics is available 48-96 hours after online publication and is updated daily on week days.
Initial download of the metrics may take a while.