Fig. 1.
Download original image
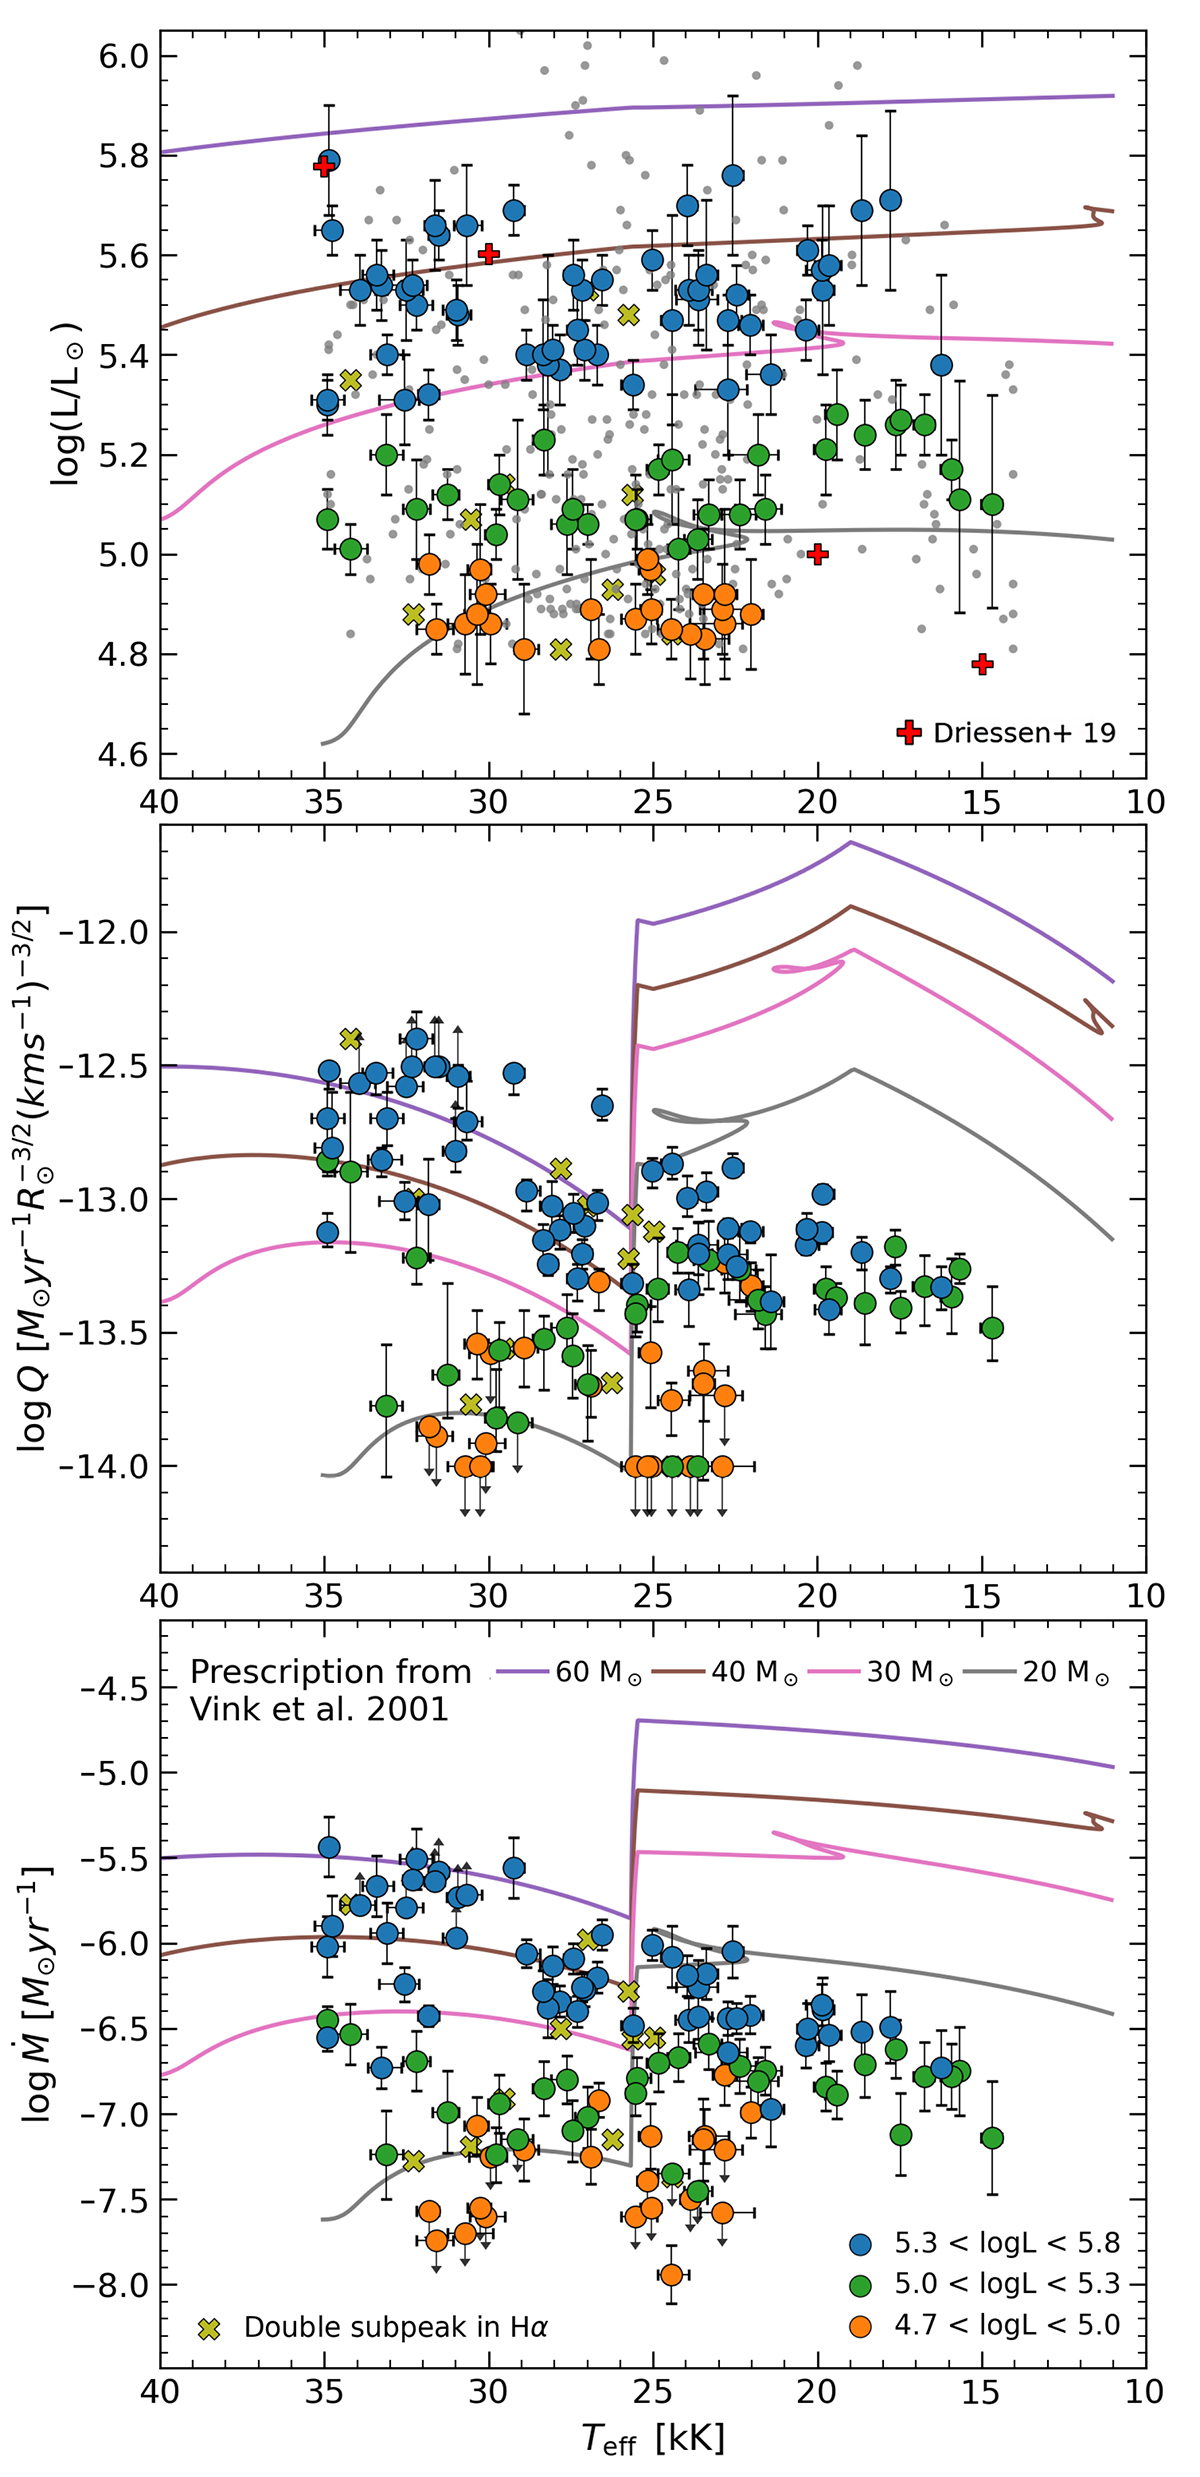
Properties of the 116 investigated Galactic stars described in Sect. 2. Top panel: location of the sample stars in the HR diagram. An additional 290 stars (without available UV spectroscopy) from de Burgos et al. (2024) are also shown for reference. Middle and bottom panels: wind-strength parameter (middle) and mass-loss rates (bottom) as a function of the effective temperature. Derived mass-loss rates were obtained using unclumped FASTWIND models. In all of the panels, different colors separate stars in three luminosity ranges, as indicated in the legend. Upper and lower limits of Q and Ṁ are indicated with arrows instead of error-bars. Four evolutionary models with different initial masses and using the Vink et al. (2001) mass-loss prescription are included for reference. We note the predicted jump in Ṁ at ≈25 kK. Stars showing double sub-peak emission in the Hα line are indicated with lime-colored crosses and are discussed in the Appendix A. The red plus symbols correspond to four models by Driessen et al. (2019) used to evaluate the clumping effects (see further explanation in Sect. 4).
Current usage metrics show cumulative count of Article Views (full-text article views including HTML views, PDF and ePub downloads, according to the available data) and Abstracts Views on Vision4Press platform.
Data correspond to usage on the plateform after 2015. The current usage metrics is available 48-96 hours after online publication and is updated daily on week days.
Initial download of the metrics may take a while.