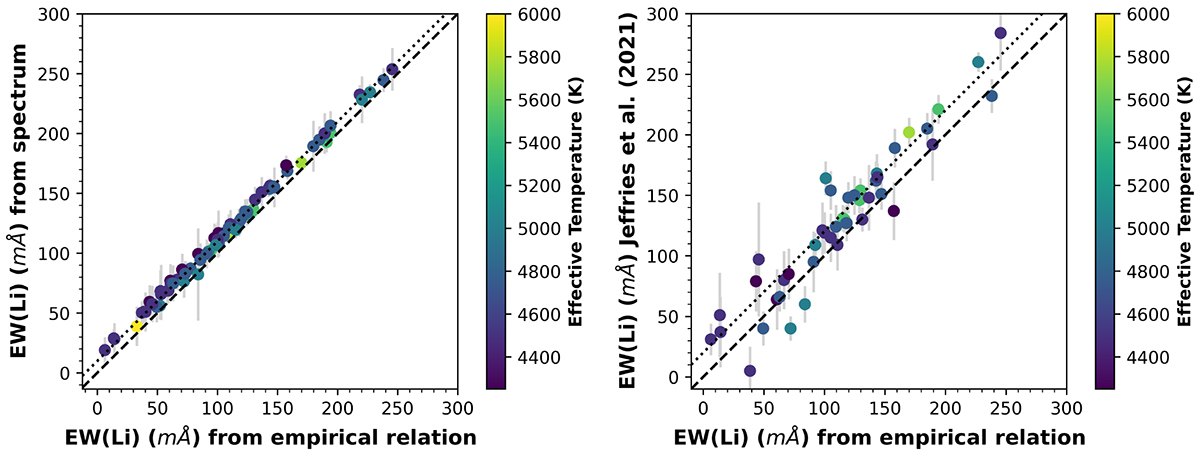
Fig. 4.
Download original image
Comparisons between the Li EWs derived by applying the empirical relation published in Soderblom et al. (1993) to the M35 spectra collected in 1999 December and 2001 February (x axes) and the EWs obtained by other methods for the same objects (y axes). Left: comparison to Li EWs obtained using synthetic spectra without Li generated with the SPECTRUM code and MARCS model atmospheres. Right: comparison to Li EWs published in Jeffries et al. (2021). In both panels, the dashed black line shows the one-to-one correspondence, while the dotted line indicates the median of the differences. The colour of each symbol indicates the effective temperature derived for the star. In both cases, the EWs indicated on the y axes are, on average, larger than the ones shown on the x axes.
Current usage metrics show cumulative count of Article Views (full-text article views including HTML views, PDF and ePub downloads, according to the available data) and Abstracts Views on Vision4Press platform.
Data correspond to usage on the plateform after 2015. The current usage metrics is available 48-96 hours after online publication and is updated daily on week days.
Initial download of the metrics may take a while.