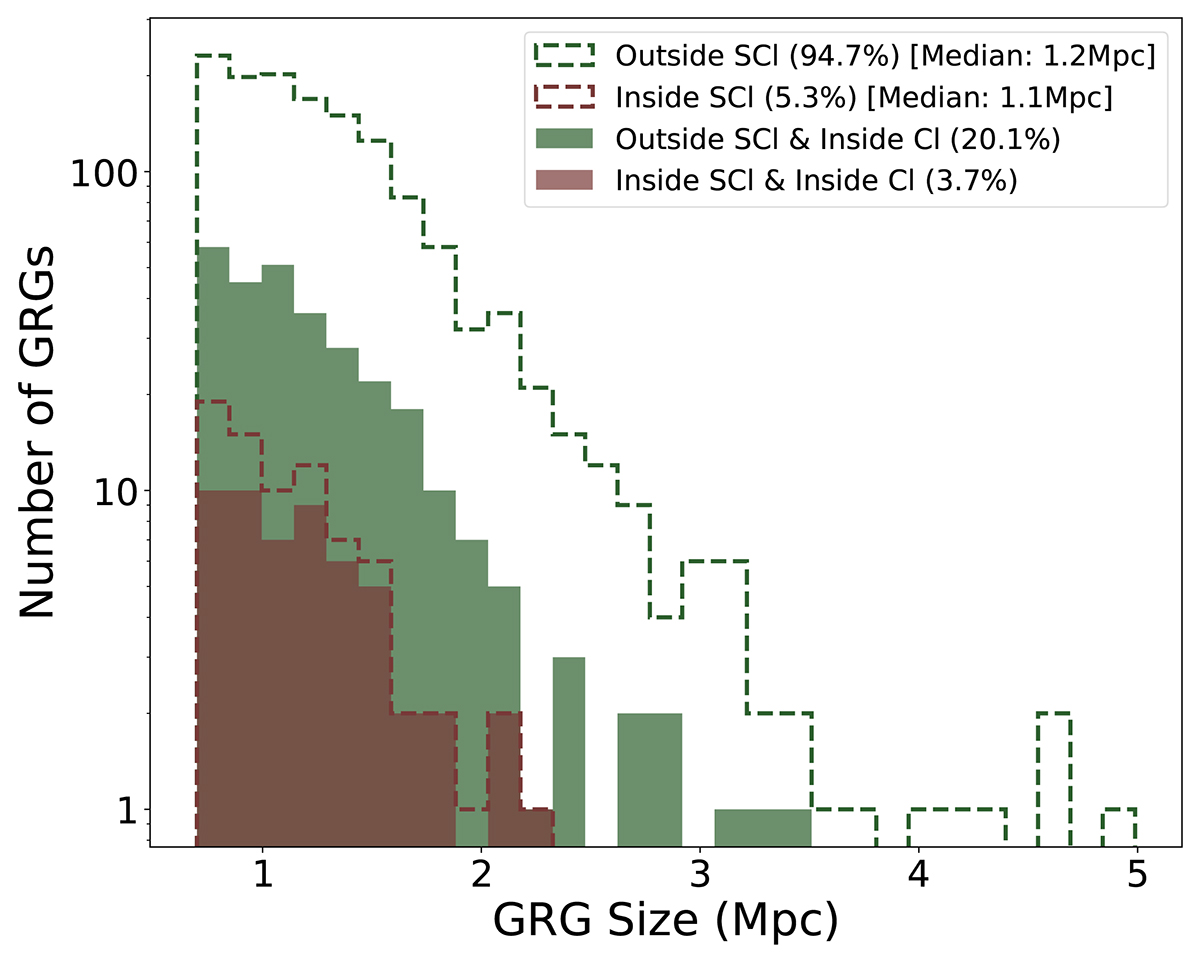
Fig. 2.
Download original image
Size distribution of GRGs. The green dashed line shows GRGs outside superclusters; the green solid histogram represents those outside superclusters but within clusters. The brown dashed line indicates GRGs within superclusters, and the brown solid histogram shows GRGs within both superclusters and clusters. The percentages and median sizes of GRGs inside and outside SCls are also shown in the legend.
Current usage metrics show cumulative count of Article Views (full-text article views including HTML views, PDF and ePub downloads, according to the available data) and Abstracts Views on Vision4Press platform.
Data correspond to usage on the plateform after 2015. The current usage metrics is available 48-96 hours after online publication and is updated daily on week days.
Initial download of the metrics may take a while.